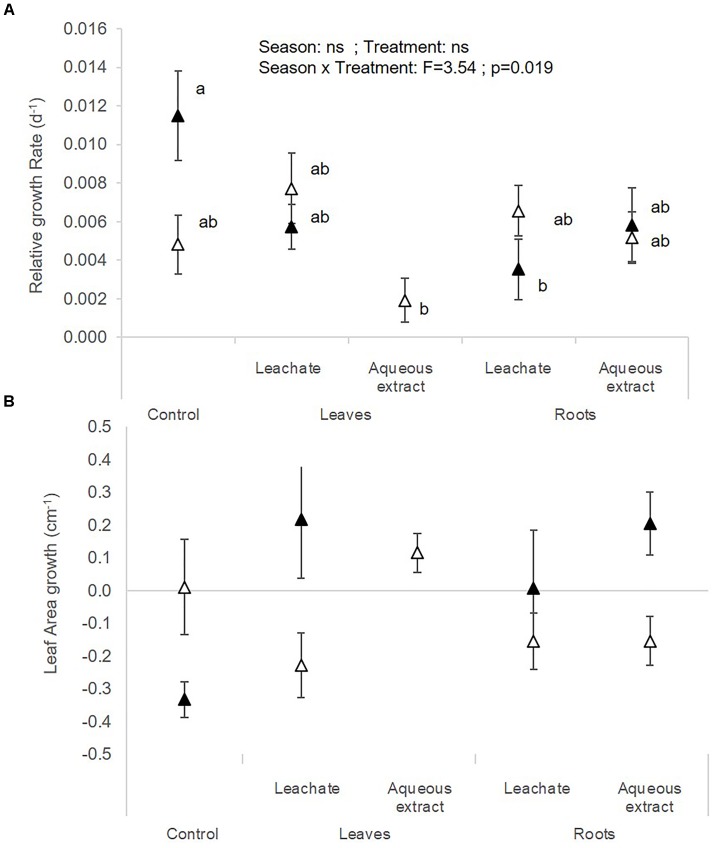
FIGURE 4.
(A) Relative growth rate and (B) leaf area growth of C. demersum (mean ± SE) in spring (white symbols) and autumn (black symbols) depending on the treatment (i.e. control, leaf leachates, leaf aqueous extracts, root leachates, root aqueous extracts) after a 28-day experiment in the laboratory. Different small letters indicate significant differences between the interaction season × treatment.

