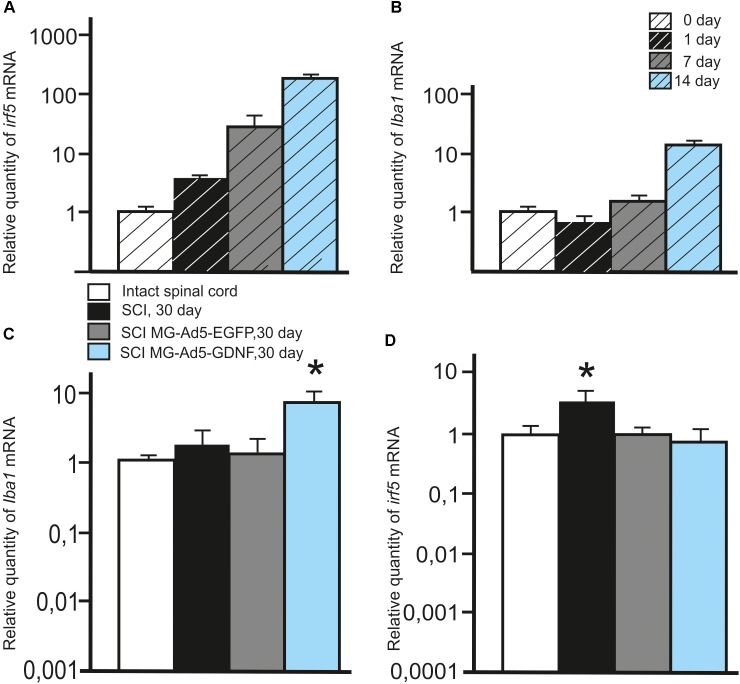
FIGURE 2.
Analysis of the expression of Iba1 and Irf5 mRNA in vitro and in vivo in the area of SCI. Irf5 (A) and Iba1 (B) mRNA expression in vitro on cultivation Days 0, 1, 7, 14. Irf5 and Iba1 mRNA expression of 0 day group was considered 100%. Differences were statistically significant between all time intervals (P < 0.05). Iba1 (C) and irf5 (D) mRNA expression in vivo on day 30 after SCI and cell transplantation. The Iba1 and irf5 mRNA expression levels in Intact controls were considered 100% (C,D). ∗P < 0.05, one-way ANOVA followed by a Tukey’s post hoc test.

