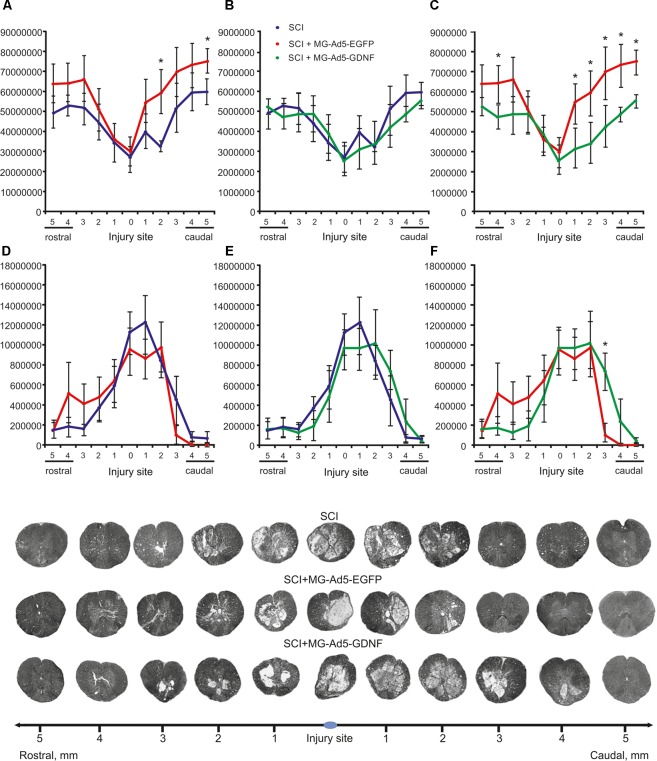
FIGURE 4.
Tissue analysis in experimental groups. An area of the intact tissue (A–C) and a total area of abnormal cavities (D–F) 5 mm rostrally and caudally from the injury epicenter on Day 30 after SCI and microglia transplantation. ∗P < 0.05, one-way ANOVA followed by a Tukey’s post hoc test. Cross sections of the injured spinal cord on Day 30 after SCI in experimental groups (bottom panel). Azur-eosin staining.

