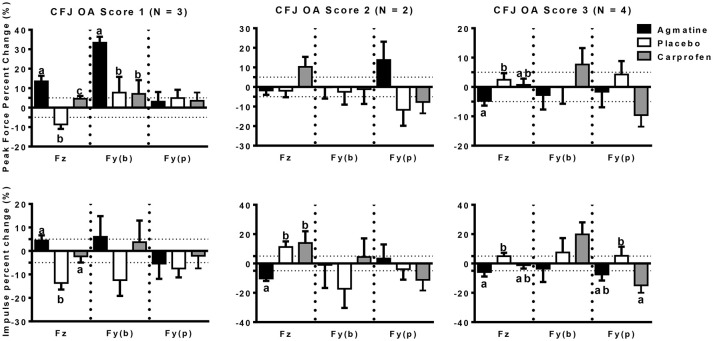
Figure 1.
Peak force (PF: upper panels) and impulse (Imp: lower panels) percent change (mean +/- SEM) in dogs with different radiographic coxofemoral joint osteoarthritis scores (CFJ OA score 1: left panels; score 2: central panels; score 3: right panels) following treatment with agmatine (black bars), placebo (white bars), or carprofen (gray bars). In each panel, Fz represents vertical force (left 3 bars), Fy(b) represents braking force (central 3 bars), and Fy(p) represents propulsion force (right 3 bars). Columns with different letters are significantly different among treatment groups for the indicated ground reaction force (p < 0.05). The dashed horizontal lines demarcate 5% positive (upper) or negative (lower) changes in each ground reaction force.

