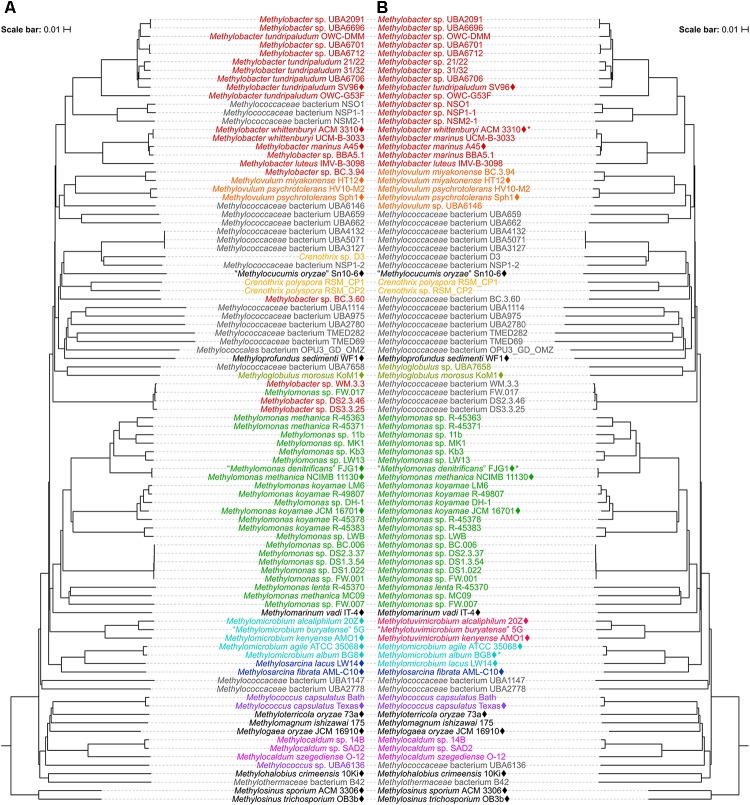
FIGURE 5.
Reclassification of the Methylococcales genomes. The phylogenetic trees are the same trees as in Figure 2 (mirror image). Names and genera (colored when containing at least two members) are shown (A) before and (B) after reclassifications. (B) Asterisks indicate later heterotypic synonyms of their senior counterparts in the same species clusters as shown in Figure 2.

