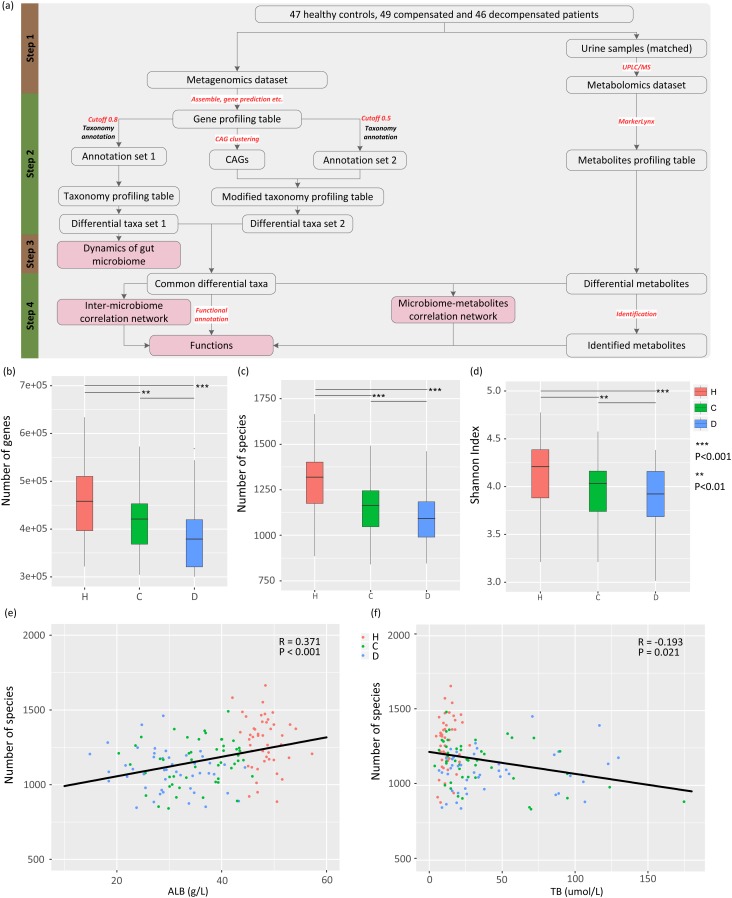
FIGURE 1.
Study design, and associations between gut microbiome and disease progression. (A) Schematic diagram of the study design. (B) Boxplot of microbial gene richness in healthy controls, compensated and decompensated patients. (C) Boxplot of microbial richness in healthy controls, compensated and decompensated patients. (D) Boxplot of the Shannon index in healthy controls, compensated and decompensated patients. (E) Correlations between microbial richness and albumin. (F) Correlations between microbial richness and total bilirubin.

