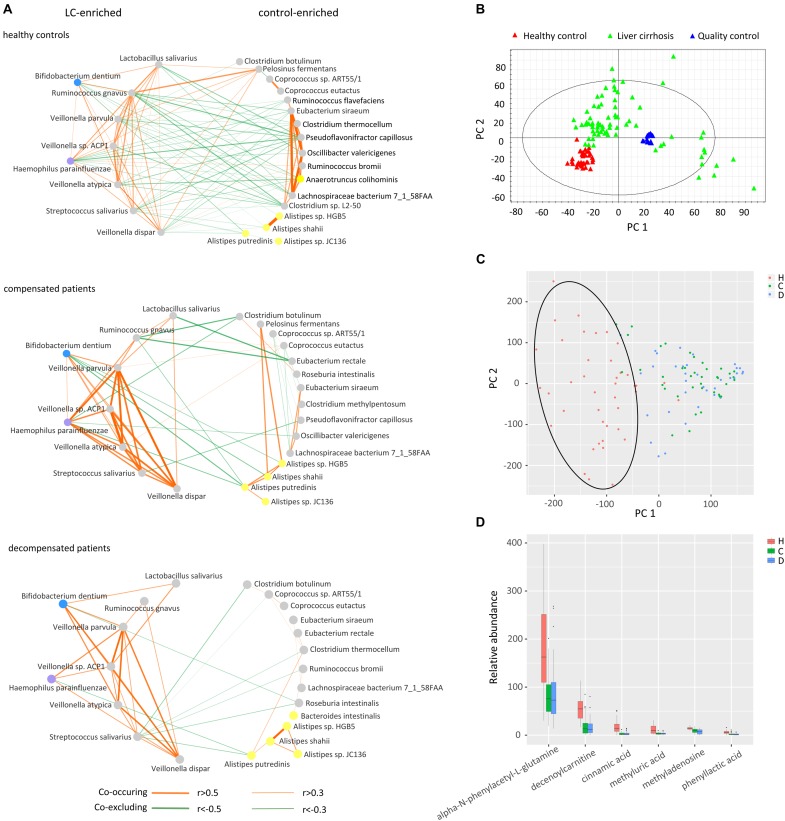
FIGURE 3.
Cross-talk of gut microbiome, score plots of urine metabolites in principal component analysis, and relative abundance of identified metabolites. (A) Correlation networks of the gut microbiome in healthy controls, compensated and decompensated patients. Red and green lines represent positive and negative regulatory networks. Nodes filled with gray, yellow, blue, and purple represent species from the phyla Firmicutes, Bacteroidetes, Actinobacteria, and Proteobacteria, respectively. (B) Score plot of healthy controls, liver cirrhotic patients and quality control samples based on raw metabolomic data without filtering. (C) Score plot of healthy controls, compensated and decompensated patients based on 75 differential metabolites. (D) Relative abundance of the six metabolites identified in healthy controls, compensated and decompensated patients.

