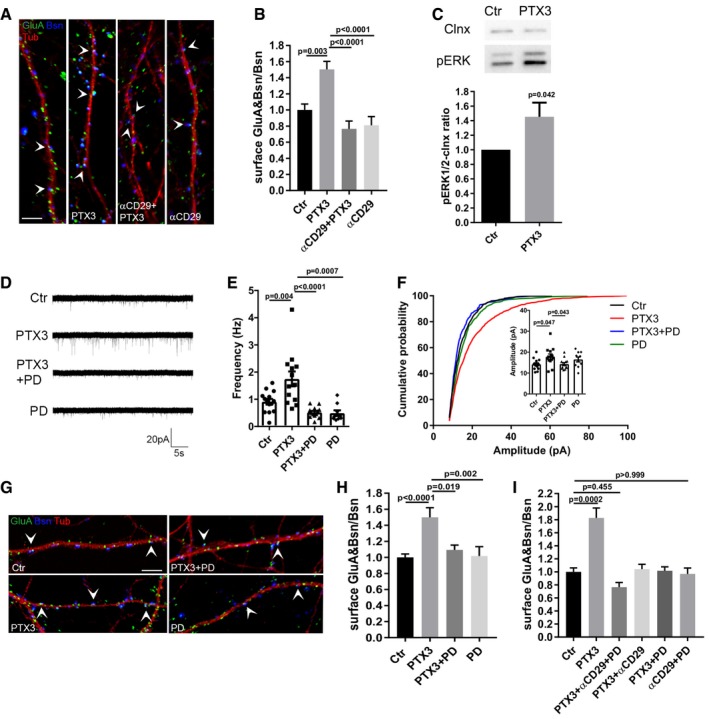
Figure 4. PTX3 exerts its effects on AMPA receptors through β1‐integrin and MAPK activation.

- Representative images showing 14DIV neurons stained for surface AMPARs (GluA, green), the presynaptic protein Bassoon (blue), and tubulin (red) in the different tested conditions. Arrowheads point to postsynaptic GluA clusters. Scale bar: 5 μm.
- Blocking β1‐integrins activity by using the specific anti‐β1 integrin monoclonal antibody prevents the PTX3‐induced postsynaptic AMPAR recruitment (Ctr = 1.000 ± 0.074, PTX3 = 1.504 ± 0.098, αCD29+PTX3 = 0.766 ± 0.097, αCD29 = 0.810 ± 0.108. Number of fields examined: 37, 33, 23, 24 respectively; one‐way ANOVA, P < 0.0001 followed by post hoc Tukey test; three independent experiments, data are presented as normalized mean values ± SEM).
- Western blotting analysis of p‐ERK levels on lysates from control and PTX3‐treated neurons upon 30‐min stimulation (Ctr = 1 ± 0; PTX3 = 1.453 ± 0.195, six independent experiments, unpaired t‐test, data are presented normalized on control and as mean ± SEM).
- Representative mEPSC traces recorded from the indicated experimental conditions.
- mEPSC frequency quantitation showing that pre‐incubation with PD98059 (30 μM) completely prevents the PTX3‐dependent increase of mEPSC frequency (Hz, Ctr = 0.911 ± 0.104; PTX3 = 1.748 ± 0.273; PTX3 + PD = 0.518 ± 0.055; PD = 0.491 ± 0.104. Number of neurons: Ctr = 14, PTX3 = 14, PTX3 + PD = 13; PD = 9; three independent experiments. One‐way ANOVA, P < 0.0001 followed by post hoc Tukey test as indicated in figure. Data are presented as a distribution plus mean ± SEM).
- Inset: average mEPSC amplitude quantitation (pA), Ctr = 14.19 ± 0.70; PTX3 = 19.09 ± 1.71; PTX3+PD = 14.31 ± 0.70, PD = 16.51 ± 1.17. Number of neurons: Ctr = 14, PTX3 = 14, PTX3+PD = 13; PD = 9; three independent experiments. Kruskal–Wallis test, P = 0.015 followed by Dunn's test as indicated in figure, data are presented as a distribution plus mean ± SEM. Cumulative probability plot of mEPSC amplitudes is analyzed with Kolmogorov–Smirnov test: Ctr vs. PTX3: P < 0.0001, D = 0.183, PTX3 vs. PTX3 + PD: P < 0.0001, D = 0.251, PTX3 vs. PD: P < 0.0001, D = 0.157.
- Representative images showing 14DIV neurons stained for surface AMPARs (GluA, green), the presynaptic protein Bassoon (blue), and tubulin (red) in the different tested conditions. Arrowheads point to postsynaptic GluA clusters. Scale bar: 5 μm.
- Quantification of the surface synaptic AMPARs normalized to the total number of Bsn [(GluA&Bsn)/Bsn] shows a statistically significant increase after PTX3 exposure, while pre‐incubation with PD98059 prevents the PTX3‐dependent increase (Ctr = 1 ± 0.042, PTX3 = 1.499 ± 0.121, PTX3 + PD = 1.093 ± 0.060, PD = 1.017 ± 0.117; number of fields examined: 49, 15, 15, 20, respectively; one‐way ANOVA, P = 0.0002 followed by post hoc Tukey test as indicated in figure; at least three independent experiments, data are presented as normalized mean values ± SEM).
- Quantification of surface synaptic GluA upon PTX3 application and simultaneous inhibition of β1‐integrin and ERK1/2 signaling pathways reveals no additive effects with respect to single αCD29 or PD applications (Ctr = 1 ± 0.061; PTX3 = 1.828 ± 0.151; αCD29 + PD + PTX3 = 0.766 ± 0.070; PTX3 + αCD29 = 1.043 ± 0.073; PTX3 + PD = 1.016 ± 0.061; PD = 0.969 ± 0.090; number of fields examined: 29, 31, 30, 23, 14, 33, respectively; one‐way ANOVA, P < 0.0001 followed by post hoc Dunn's test as indicated in figure; at least three independent experiments, data are presented as normalized mean values ± SEM).
Source data are available online for this figure.
