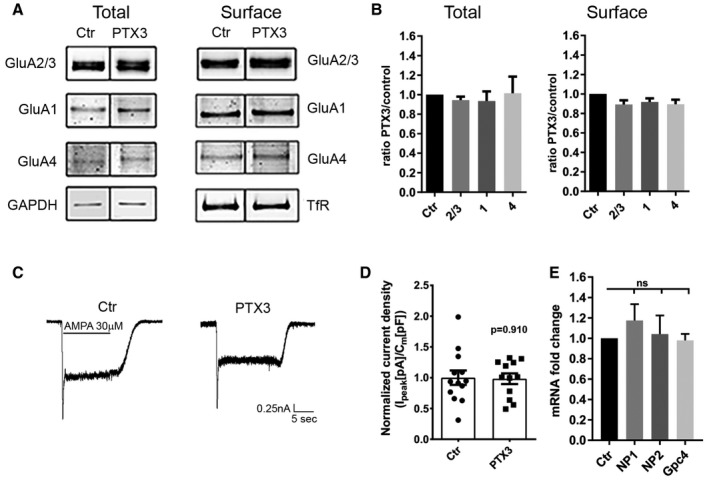
Figure EV4. PTX3 does not affect the total amount of surface AMPARs.

-
AWestern blotting analysis of total and surface (biotinylated) GluA subunits of control and PTX3‐treated neurons as indicated showing no differences either for the total levels of expression or for the global surface levels of the different GluA subunits.
-
BQuantification of total receptors levels was normalized to GAPDH in each sample, whereas surface GluA subunits were normalized to surface transferrin receptor, TfR, in each sample. Data are shown as ratio PTX3 over control for each GluA subunit (total: Ctr = 1 ± 0; GluA2/3 = 0.943 ± 0.036, GluA1 = 0.93 ± 0.098, GluA4 = 1.014 ± 0.17. Number of samples: 7, 6, 7, 7 respectively; Kruskal–Wallis test, P = 0.472. Surface: Ctr = 1 ± 0; GluA2/3 = 0.89 ± 0.041, GluA1 = 0.92 ± 0.038, GluA4 = 0.89 ± 0.047; number of samples: 6, 6, 6, 6, respectively. Kruskal–Wallis test, P = 0.112; 3 independent experiments, normalized values, mean ± SEM).
-
C, D(C) Representative traces and (D) quantitative analysis of total current density evoked by application of 30 μM AMPA in control and PTX3‐treated cultures (Ctr = 1 ± 0.117; PTX3 = 0.983 ± 0.87; Student's t‐test; number of neurons: Ctr = 13, PTX3 = 12; 3 independent experiments, data are presented as distribution plus normalized mean ± SEM).
-
EPTX3 does not affect neuronal pentraxins and glypican 4 expression. qRT–PCR analysis of mRNA levels for NP1, NP2, and glypican 4 (Gpc4) performed in pure neuronal cultures treated with PTX3 (1 μg/ml for 48 h). qPCR fold change normalized on control: Ctr = 1.000 ± 0.000; NP1 = 1.174 ± 0.16; NP2 = 1.041 ± 0.182; Gpc4 = 0.980 ± 0.062. Wilcoxon test: Ctr vs. NP1: P = 0.312, Ctr vs. NP2: P = 0.688, Ctr vs. Gpc4: P > 0.999. Graphs show mean ± SEM. At least 5 independent experiments.
Source data are available online for this figure.
