-
A
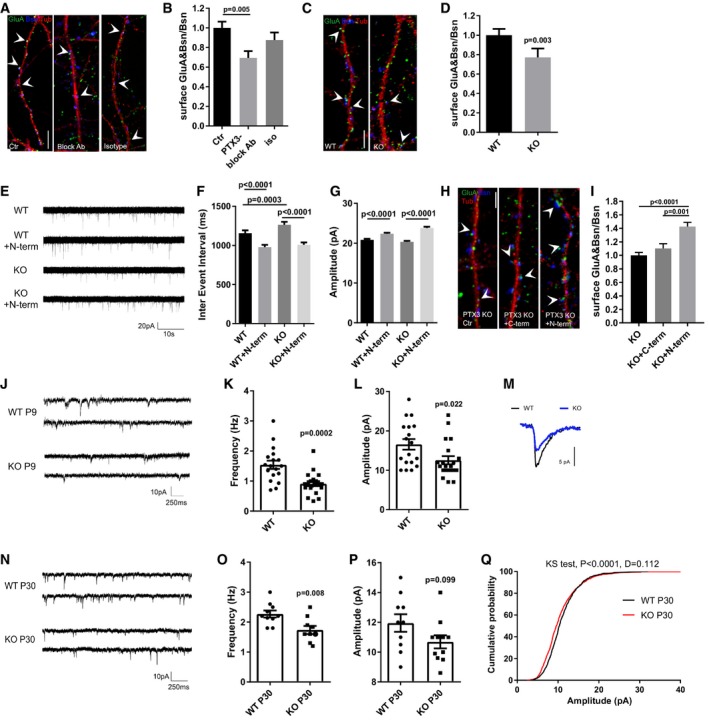
Representative images of 14DIV neurons stained for surface AMPARs (GluA, green), Bassoon (blue), and tubulin (red) in the different tested conditions. Arrowheads point to postsynaptic GluA clusters. Scale bar: 5 μm.
-
B
Quantification of the surface synaptic AMPARs normalized to the total number of Bsn shows a decrease of the surface synaptic AMPAR clusters upon chronic application of the PTX3 blocking antibody to mixed cultures (Ctr = 1.000 ± 0.063, PTX3 block = 0.694 ± 0.069, isotype Ab = 0.876 ± 0.077. Number of fields examined: 34, 23, 19, respectively; one‐way ANOVA, P < 0.0001 followed by post hoc Tukey test as indicated in figure; three independent experiments, data are presented as normalized mean values ± SEM).
-
C
Representative images of 14DIV WT and PTX3 KO neurons stained for surface AMPARs (GluA, green), Bassoon (blue), and tubulin (red). Arrowheads point to postsynaptic GluA clusters. Scale bar: 5 μm.
-
D
Quantification of the surface synaptic AMPARs normalized to the total number of Bsn shows a reduction in PTX3 KO cultures with respect to WT (WT = 1 ± 0.065, KO = 0.771 ± 0.0.92; number of fields examined: 36 and 42, respectively; Mann–Whitney test; number of animals 5 WT and 6 PTX3 KO, data are presented as normalized mean values ± SEM).
-
E
Examples of mEPSCs recorded in the indicated experimental conditions.
-
F
Quantitation of mEPSC inter‐event interval showing a rescue of mEPSC frequency in PTX3 KO cultures treated with the N‐terminal fragment of PTX3 (WT = 1158 ± 34.67; WT+N‐term = 979.1 ± 28.27; PTX3 KO = 1263 ± 38.99; PTX3 KO+N‐term = 1008 ± 30.14. Number of neurons: WT, Ctr = 25, WT+N‐term = 29; PTX3 KO, Ctr = 24; PTX3 KO+N‐term = 22; three independent experiments. Kruskal–Wallis test, P < 0.0001 followed by Dunn's test as indicated in figure, data are presented as mean ± SEM).
-
G
Quantitation of mEPSC amplitude showing a rescue in PTX3 KO cultures treated with the N‐terminal fragment of PTX3 (pA, WT = 20.85 ± 0.249 WT+N‐term = 22.37 ± 0.234; PTX3 KO = 20.31 ± 0.264; PTX3 KO+N‐term = 23.8 ± 0.316. Number of neurons: WT, Ctr = 25, WT+N‐term = 29; PTX3 KO, Ctr = 24; PTX3 KO+N‐term = 22; 3 independent experiments. Kruskal–Wallis test, P < 0.0001 followed by Dunn's test as indicated in figure, data are presented as mean ± SEM).
-
H
Representative images of 14DIV PTX3 KO neurons (Ctr, +N‐terminal PTX3, +C‐terminal PTX3) stained for surface AMPARs (GluA, green), Bassoon (blue), and tubulin (red). Arrowheads point to postsynaptic GluA clusters. Scale bar: 5 μm.
-
I
Quantification of the surface synaptic AMPARs normalized to the total number of Bsn shows an increase in PTX3 KO treated with N‐terminal fragment of PTX3 but not with the C‐terminal fragment (PTX3 KO = 1.000 ± 0.042, PTX3 KO + C‐term = 1.103 ± 0.070, PTX3 KO + N‐term = 1.428 ± 0.061. Number of fields examined: 63, 38, 57 respectively; Kruskal–Wallis test, P < 0.0001 followed by Dunn's test; 3 independent experiments, data are presented as normalized mean values ± SEM).
-
J–L
(J) Examples of mEPSCs recordings in WT and PTX3 KO (littermates) hippocampal slices at P8‐9 showing that frequency (K) and amplitude (L) are significantly decreased in KO neurons with respect to WT (Hz: WT = 1.54 ± 0.136; PTX3 KO = 0.912 ± 0.083; Mann–Whitney test. pA: WT = 16.57 ± 1.334; PTX3 KO = 12.55 ± 1.037; unpaired t‐test. Data are presented as a distribution plus mean ± SEM. WT: 18 cells, 4 mice; PTX3 KO: 20 cells, 5 mice).
-
M
Representative superimposed average traces aligned by rise time.
-
N
Examples of mEPSCs recordings of P30 WT and PTX3 KO hippocampal slices.
-
O
Quantification of mEPSC frequency showing reduced frequency in PTX3 KO mice with respect to WT (Hz: WT = 2.27 ± 0.115; PTX3 KO = 1.74 ± 0.136. WT: 10 cells, 4 mice; PTX3 KO: 11 cells, 5 mice. Unpaired t‐test P = 0.008. Data are presented as a distribution plus mean ± SEM).
-
P, Q
(P) No difference in the average amplitude is evident (pA: WT = 11.95 ± 0.589; PTX3 KO = 10.69 ± 0.438; unpaired t‐test P = 0.099. Data are presented as a distribution plus mean ± SEM. WT: 10 cells, 4 mice; PTX3 KO: 11 cells, 5 mice); however, the cumulative probability plot of amplitudes (Q) for mEPSCs in WT and PTX3 KO shows that there is a significant shift in the distribution by the Kolmogorov–Smirnov test (P < 0.0001, D = 0.112).

