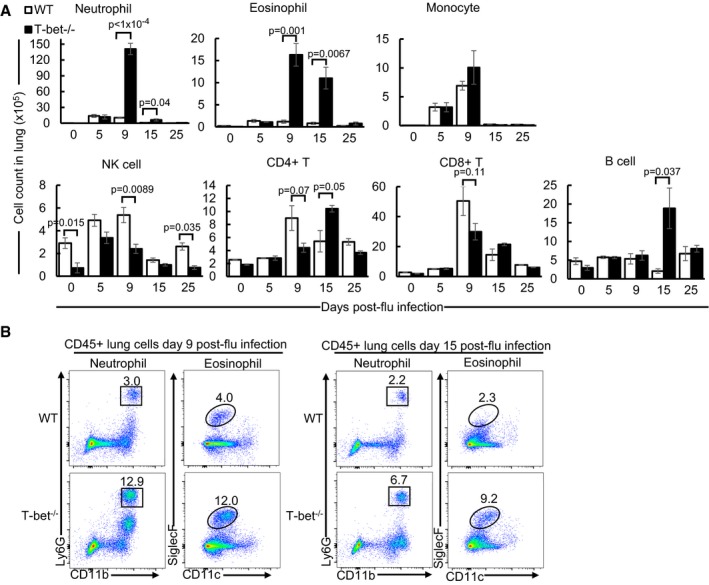
Figure 2. Increased infiltration of neutrophils, eosinophils and B cells in T‐bet‐deficient lungs infected with influenza virus.

- Absolute cell counts from lungs of sub‐lethally influenza virus‐infected mice following analysis by flow cytometry. After gating out alveolar macrophages by forward and side scatter, immune cells are defined as follows: neutrophil (Ly6G+CD11b+SiglecF−Ly6Cint), eosinophil (SiglecF+CD11c−/+F4/80−CD64−), monocyte (Ly6G−CD11b+MHCII−SiglecF−), natural killer cell (NK, B220−/intNK1.1+), B cell (B220hiNK1.1−), CD8+ T cell (TCRβ+CD8+), CD4+ T cell (TCRβ+CD4+). See also Fig EV2C and D.
- Flow cytometry plots of neutrophils and eosinophils in lungs at days 9 and 15 post‐sub‐lethal influenza virus infection. Numbers in plots indicate frequency of gated immune cells in each throughput.
