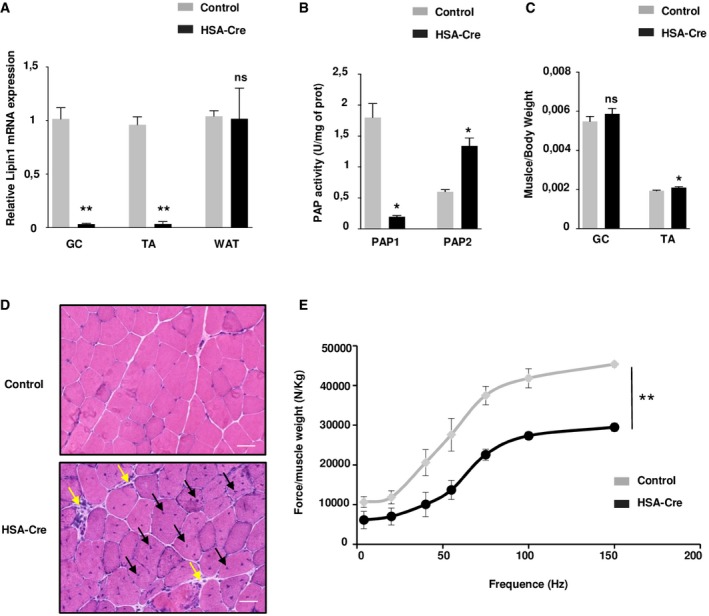
Figure 1. HSA‐Cre mice develop myopathy.

- Quantitative RT–PCR shows that Lpin1 expression is depleted in the skeletal muscles gastrocnemius (GC) and tibialis anterior (TA), but not in white adipose tissue (WAT) from 3‐month‐old HSA Cre/+ /Lpin1 fEx2‐3/fEx2‐3 mice (HSA‐Cre) compared to control mice. Expression levels are corrected for expression of the control gene Pinin and presented in the graph as fold change relative to control mice. Data are mean ± SEM (n = 5; **P < 0.01).
- PAP1 and PAP2 activities were, respectively, substantially decreased and increased in TA, of HSA‐Cre mice as compared to control mice, respectively. Data are mean ± SEM (n = 6; *P < 0.05).
- Measurements of muscle/body weight ratio of GC and TA of 3‐month‐old HSA‐Cre and control mice. Data are mean ± SEM (n = 6; *P < 0.05).
- Hematoxylin and eosin (HE) staining of representative transverse sections of GC muscles from 3‐month‐old HSA‐Cre and control mice. The black arrows indicate fibers with centrally located nuclei, and yellow arrows indicate mononuclear cell infiltration. Scale bars: 40 μm.
- Relative force measurements after normalization of absolute tetanic force to GC muscle weight from 3‐month‐old HSA‐Cre and control male mice. Data are mean ± SEM (n = 3; **P < 0.01).
