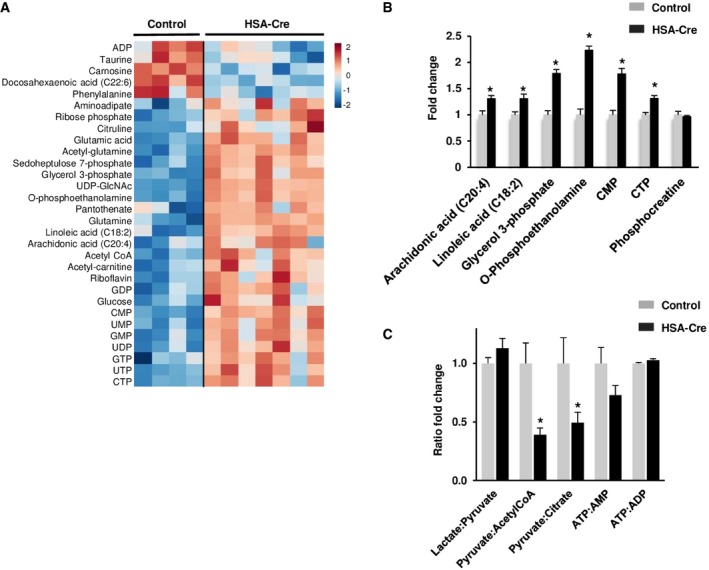
Figure 5. Metabolomics analysis of HSA‐Cre muscles.

- Metabolomics profile of GC muscle of 4‐month‐old HSA‐Cre (n = 7) and control (n = 4) mice presented as heatmap visualization and hierarchical clustering analysis of compounds with P ≤ 0.05, Student's t‐test (see Materials and Methods for details). Rows: metabolites; columns: samples; color key indicates metabolite expression value (blue: lowest; red: highest).
- Fold change of phospholipid precursors in GC muscles of 4‐month‐old HSA‐Cre (n = 7) and control (n = 4) mice measured by liquid chromatography (LC) tandem mass spectrometry (MS/MS) (*P < 0.05).
- Fold change of Lactate/Pyruvate, Pyruvate/Acetyl‐CoA, Pyruvate/Citrate, ATP/AMP, and ATP/ADP ratios in GC muscles of 4‐month‐old HSA‐Cre (n = 7) and control (n = 4) mice (*P < 0.05).
