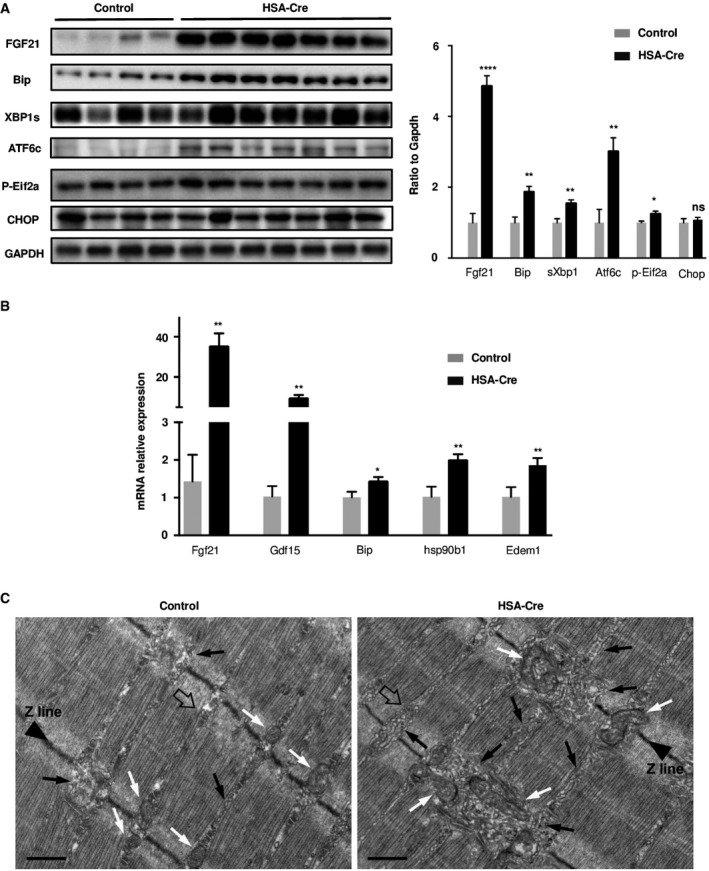
Figure 6. Lipin1 deficiency triggers an ER stress in muscles and leads to Unfolded Protein Response activation.

- UPR activation was analyzed by immunoblotting with indicated antibodies in GC muscles of 4‐month‐old HSA‐Cre (n = 7) and control (n = 4) mice. Quantification by densitometric analyses of Fgf21, Bip, sXbp1 Atf6 cleaved form, p‐Eif2a, and Chop protein levels is presented as a graph. Data are normalized to Gapdh and expressed as a fold change relative to the control mice. Data are mean ± SEM (*P < 0.05, **P < 0.01, ****P < 0.0001).
- Quantitative RT–PCR measurement of Fgf21, Gdf15, Bip/Grp78, hsp90b1, and Edem1 in GC muscles from 4‐month‐old HSA‐Cre (n = 7) and control (n = 4) mice. Data are mean ± SEM (*P < 0.05, **P < 0.01).
- EM analysis of EDL fibers of HSA‐Cre mice revealed the presence of areas in which the non‐junctional SR is more vesiculated and fragmented compared to control (black arrows). Remodeling of the SR is also accompanied by modification in the positioning of mitochondria (white arrows). A representative Calcium Release Unit (CRU) is indicated (empty arrow). Scale bars: 0.50 μm.
