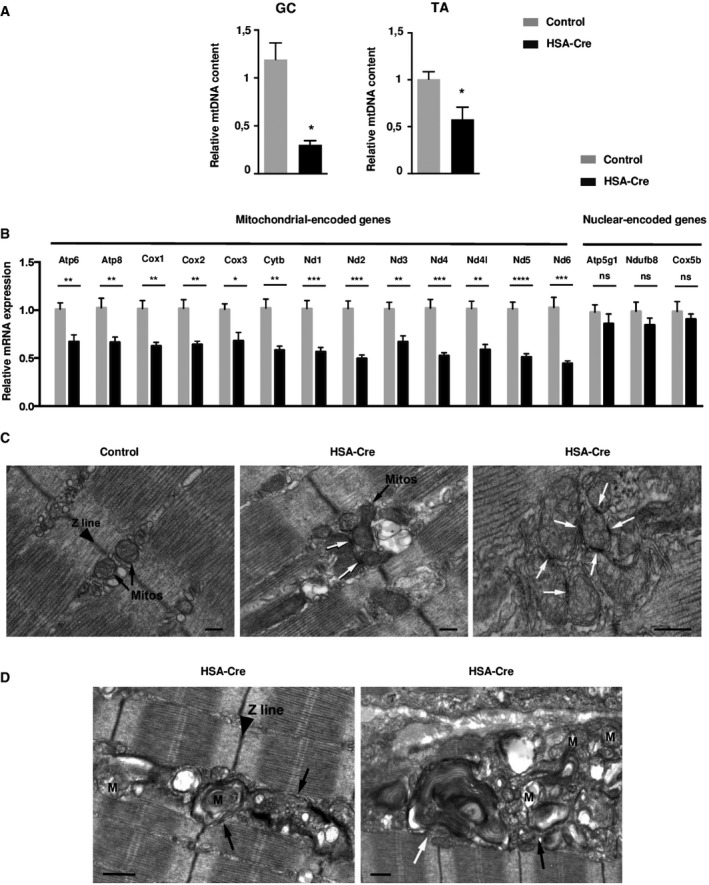
Figure 7. mtDNA levels and mitochondrial morphology are impaired in HSA‐Cre muscles.

- The relative mtDNA copy number was determined by the ratio of mitochondrial DNA‐encoded cytochrome B (CytB) and nuclear‐encoded NADH dehydrogenase (ubiquinone) flavoprotein 1 (Ndufv1) genes in GC and TA from HSA‐Cre and control mice. Data are mean ± SEM (n = 4; *P < 0.05).
- Mitochondria‐encoded gene and nuclear‐encoded gene expression levels by quantitative RT–PCR in GC muscles from 4‐month‐old HSA‐Cre (n = 7) and control (n = 4) mice. Data are mean ± SEM (*P < 0.05, **P < 0.01, ***P < 0.001, ****P < 0.0001).
- Electron micrographs of HSA‐Cre EDL muscles of 3‐month‐old mice showed that mitochondria are almost exclusively positioned at the two sides of Z lines in EDL fibers from control mice (black arrows). On the other hand, in lipin1‐deficient EDL fibers mitochondria are more often clustered and display electron‐dense contact sites (white arrows). Scale bars: 0.20 μm.
- Ultrastructural analysis of HSA‐Cre EDL muscles revealed the presence of numerous autophagic vacuoles of different morphologies (autophagosomes and lysosomes, black arrows; multilamellar bodies, white arrow) containing amorphous material and possibly degraded mitochondria (M). Scale bars: 0.50 μm.
