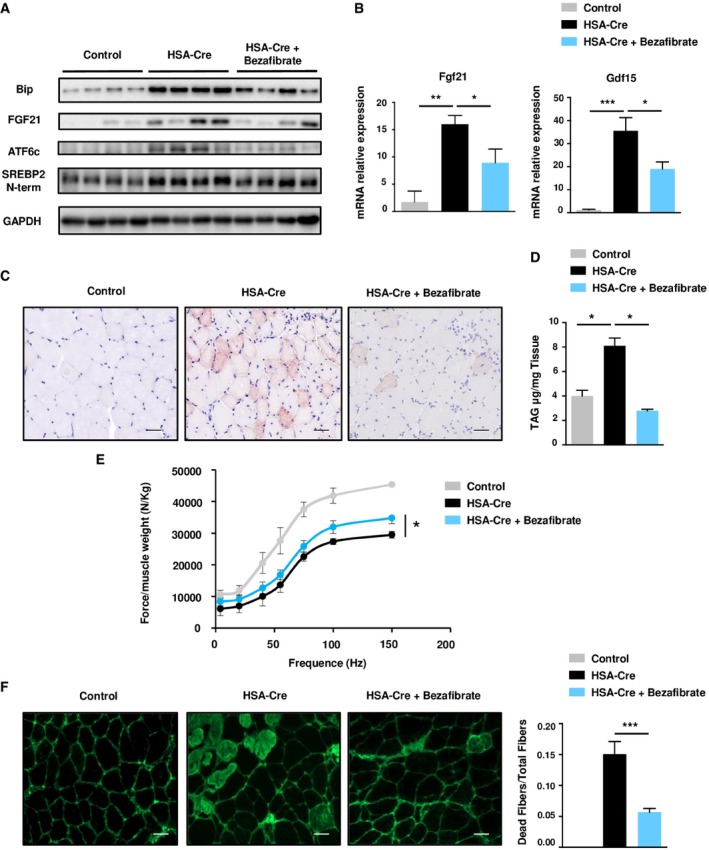
Representative immunoblots from protein extract of GC muscles of 4‐month‐old control, HSA‐Cre untreated and HSA‐Cre Bezafibrate‐treated mice, with the indicated antibodies.
Quantitative RT–PCR measurement of Fgf21 and GDF15 expression in GC muscle of 4‐month‐old control, HSA‐Cre untreated and HSA‐Cre Bezafibrate‐treated mice. Data are mean ± SEM (n = 4, *P < 0.05, **P < 0.01, ***P < 0.001).
Histological analysis of TA muscles of 4‐month‐old control, HSA‐Cre untreated and HSA‐Cre Bezafibrate‐treated mice by Oil Red O staining to detect the neutral lipids. Scale bars: 40 μm.
TAG level measurement in GC muscles of 4‐month‐old control, HSA‐Cre untreated and HSA‐Cre Bezafibrate‐treated mice. Data are mean ± SEM (n = 4; *P < 0.05).
In vivo force measurements performed on GC muscles of 4‐month‐old control, HSA‐Cre untreated and HSA‐Cre Bezafibrate‐treated mice. Data are mean ± SEM (n = 4; *P < 0.05).
Representative staining of IgG‐positive fibers on frozen sections of TA of 4‐month‐old control, HSA‐Cre untreated and HSA‐Cre Bezafibrate‐treated mice. The sections were stained with a secondary fluorescent anti‐mouse IgG antibody. Quantification of the number of necrotic fibers over the total number of fibers. Data are mean ± SEM (n = 4; ***P < 0.001). Scale bars: 40 μm.
‐test was used for statistical analysis.