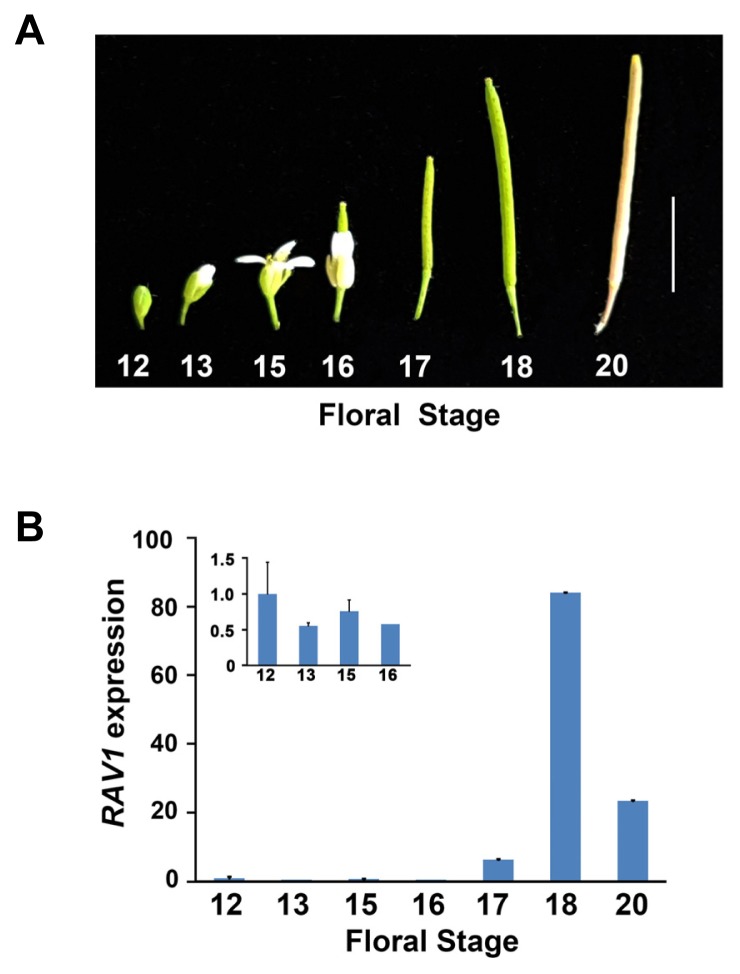
Fig. 3. Expression analyses of RAV1 during seed development.
(A) Picture of developing flower and siliques of a wild-type plant from which RNA was isolated. Scale bar indicates 10 mm. (B) Relative expression of RAV1 determined using qRT-PCR analysis during indicated flower stages. Inset denotes the expression of RAV1 from stages 12 to 16. qRT-PCR was conducted in triplicate in each experiment and data were normalized to the expression of Ubiquitin. Experiments were independently repeated twice. Error bars indicate standard error.

