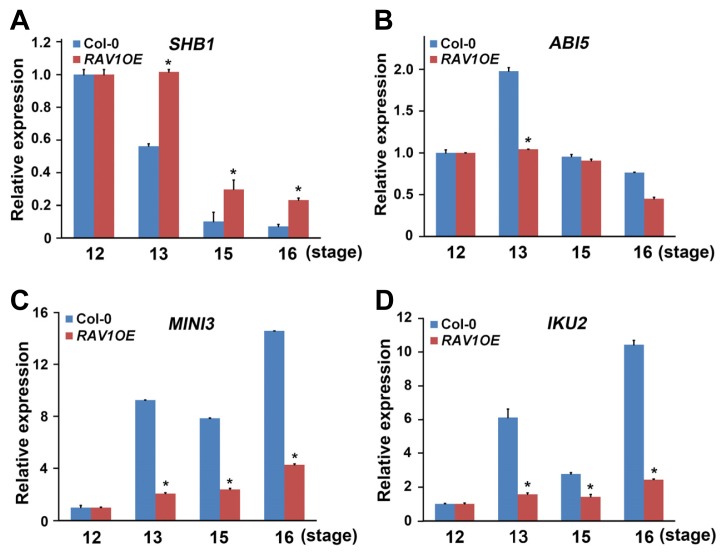
Fig. 4. Expression analyses of the genes associated with embryo and endosperm development.
Expressions level of SHB1 (A), ABI5 (B), MINI3 (C), and IKU2 (D) were analyzed during the period indicated as the flower stage of the RAV1-overexpressing plants compared with those of wild-type plants. In each experiment, RNAs were examined in triplicate in each experiment and data were normalized to the expression of Ubiquitin. Experiments were independently repeated three times. Error bars indicate standard error. (*P < 0.01 compared with wild-type plant at the same floral stage)

