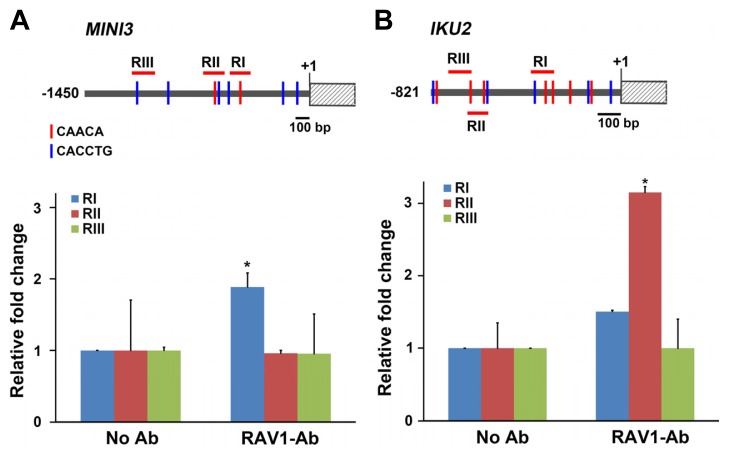
Fig. 5. RAV1 directly binds to the promoter of MIN3 and IKU2.
A and B. Two different RAV1-binding sites are marked with red and blue bars in a schematic representation of the MINI3 and IKU2 promoters, respectively (upper panels). Graph showing the relative amplification of the fragments containing RAV1-binding sites of MINI3 or IKU2 using ChIP analyses (lower panels). (*P < 0.05 compared with the same amplified region without antibody treatment)

