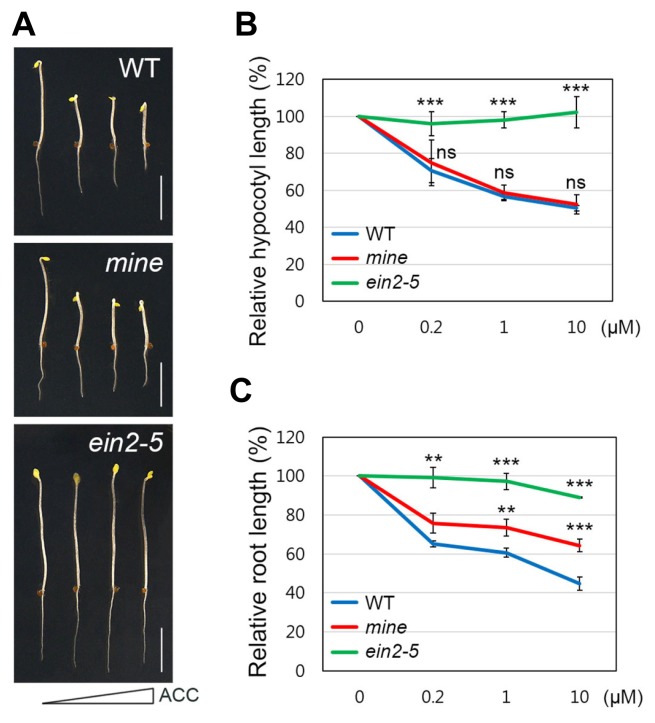
Fig. 1. The mine mutant shows root-specific insensitivity to ACC.
(A) Growth phenotypes of 4-d-old etiolated WT, mine, and ein2-5 seedlings grown in MS plates supplemented with increasing concentrations of ACC (0, 0.2, 1, and 10 μM). Scale bars= 0.5 cm. (B) The graph illustrates relative hypocotyl responses of 4-d-old etiolated WT, mine, and ein2-5 to ACC, with increasing concentrations. (C) Relative root responses of 4-d-old etiolated WT, mine, and ein2-5 seedlings to ACC, with increasing concentrations. Error bars indicate ±SD from three biological replicates. Asterisks indicate statistically significant differences compared to WT, as determined by Student’s t-test (**P < 0.01 and ***P < 0.001; ns: statistically not significant).

