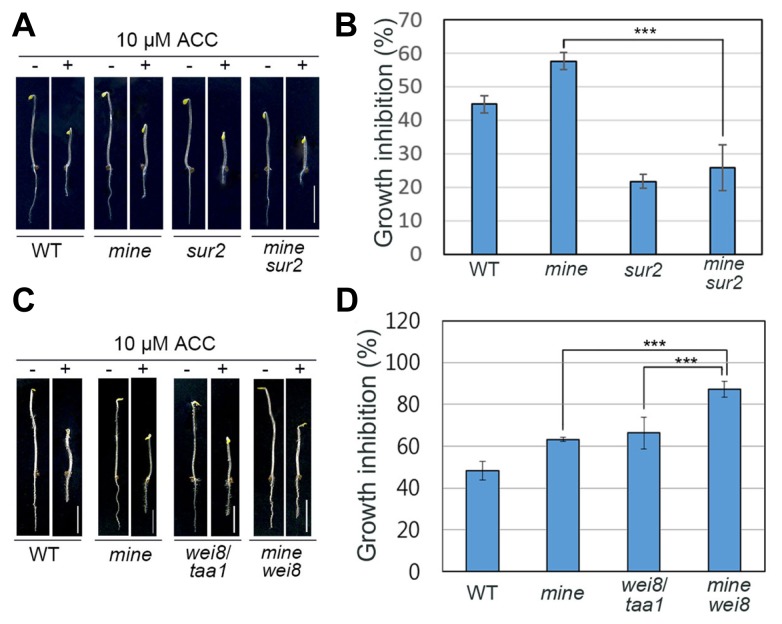
Fig. 4. Genetic analysis of ethylene-induced auxin biosynthesis in mine roots.
(A) Growth phenotypes of 4-d-old etiolated WT, mine, sur2, and mine sur2 seedlings in the presence of ACC (10 μM). (B) The graph illustrates relative growth inhibition of WT, mine, sur2, and mine sur2 roots under 10 μM ACC treatment. (C) Growth phenotypes of 4-d-old WT, mine, wei8/taa1, and mine wei8 seedlings in the presence of 10 μM ACC. (D) Relative growth inhibition of WT, mine, wei8/taa1, and mine wei8 roots under 10 μM ACC treatment. Error bars indicate ±SD from three biological replicates. Statistically significant differences were determined by Student’s t-test (***P < 0.001). Scale bars = 0.5 cm.

