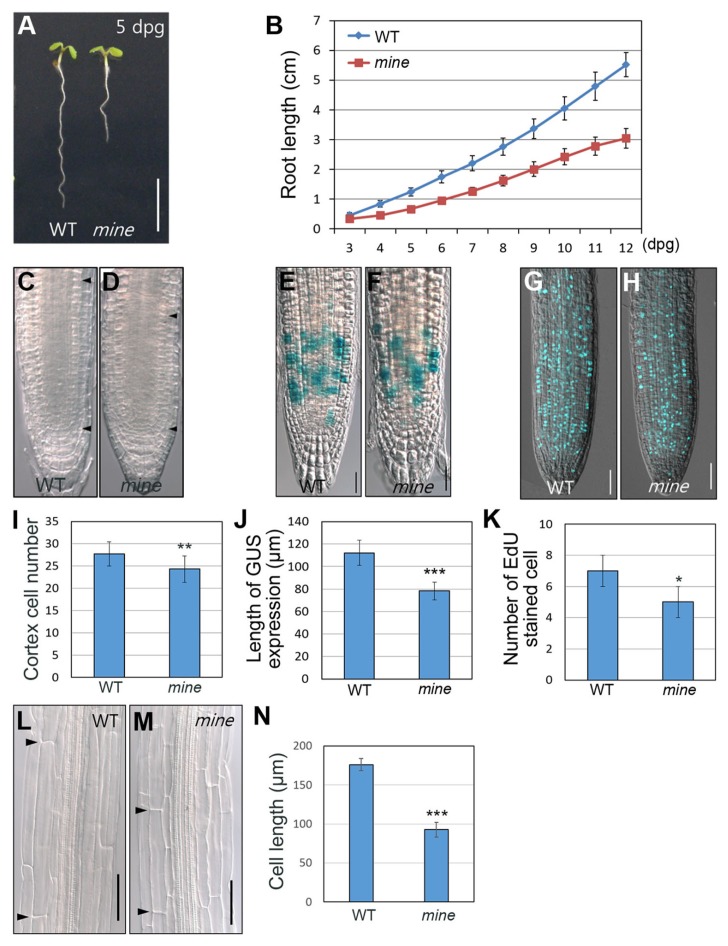
Fig. 5. The mine mutant exhibits retarded root growth under normal growth conditions.
(A) Growth phenotypes of WT and mine seedlings grown in MS plates at 5 dpg (days postgermination). (B) Root growth assay of WT and mine seedlings under normal growth conditions. (C, D, I) Meristem size was determined by counting the cortex cell numbers from the QC to the point at which cell size starts to increase (arrowheads demarcate the meristem zone). (E, F, J) CYCB1::GUS expression in 5-d-old WT and mine roots. (G, H, K) EdU assays in WT and mine roots at 5 dpg. (L, M, N) Analysis of cortex cell elongation in the elongation zone (arrowheads indicate the boundaries of a cortex cell). Error bars indicate ±SD from three biological replicates. Asterisks indicate statistically significant differences compared to WT, as determined by Student’s t-test (*P < 0.05, **P < 0.01, and ***P < 0.001). Scale bars = 0.5 cm in A and 50 μm in E, F, G, H, L, M.

