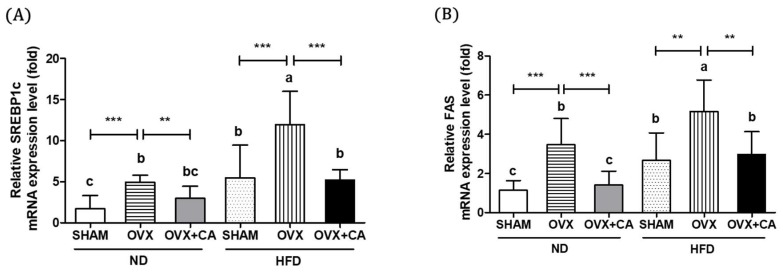
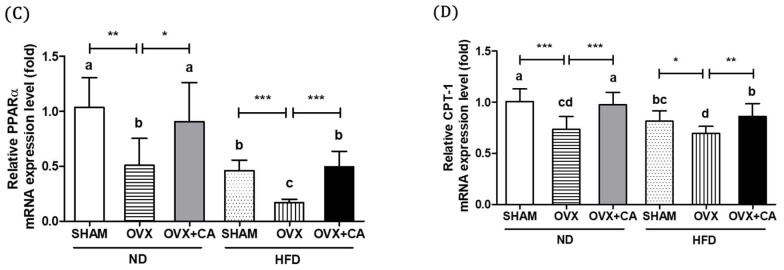
Figure 2.
Effect of CA on the hepatic SREBP1c, FAS, PPARα, and CPT-1 mRNA expression. The expressions of the SREBP1c (A), FAS (B), PPARα, (C) and CPT-1 (D) mRNA were measured by real-time PCR analysis. The values are presented as the mean ± SD. Bars with letters (a, b, c, and d) are significantly different from each other, as determined by Duncan’s multiple range test. (p < 0.05, * p < 0.05, ** p < 0.01, and *** p < 0.001). SHAM—sham-operated; OVX—ovariectomized; ND—normal diet; HFD—high fat diet; CA—carnosic acid.


