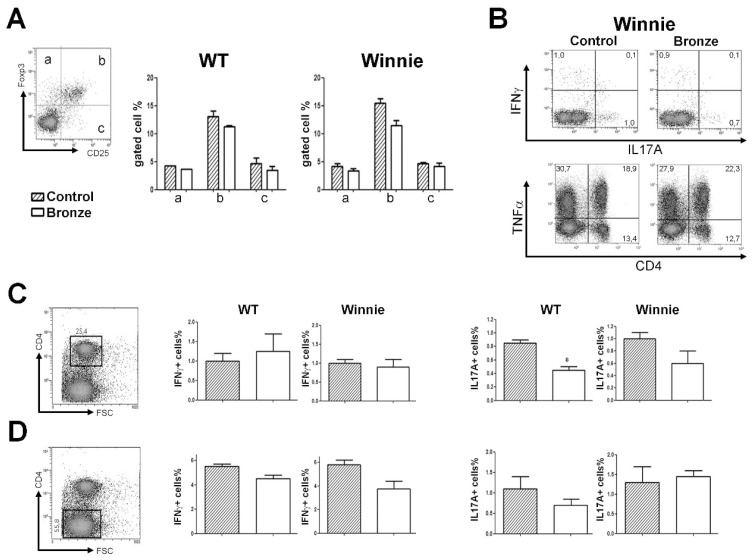
Figure 2.
Mesenteric lymph node T cell cytokine staining. (A) Representative Treg staining of CD4+ cells. Histograms represent the percentages of Foxp3+CD25+ cells in the MLNs of mice fed with Control-enriched diet (striped bars) and Bronze-enriched diet (white bars). (B) Representative density plot analysis of intracellular staining of MLNs from Winnie mice. (C,D) Intracellular staining of IFNγ and IL-17A in the CD4+ (C) and CD4− (D) MLN cells of WT and Winnie mice after 2 weeks of Control or Bronze-enriched diets. Statistical evaluation was performed using unpaired two-tailed Student’s t-tests. * P < 0.05.

