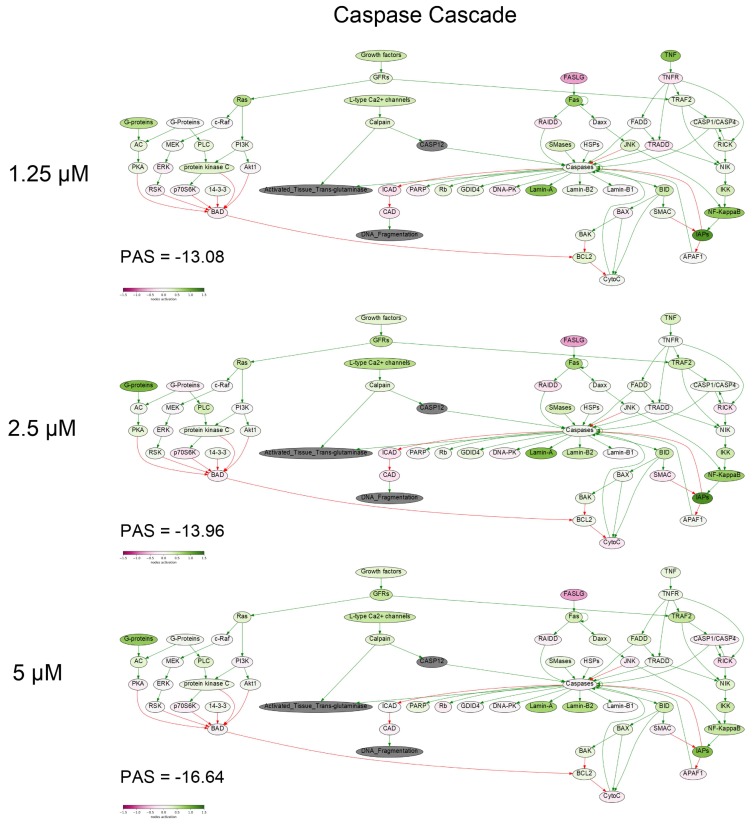
Figure 6.
Caspase cascade pathway was inhibited in the PM III treated cells. The pathway was visualized using the Oncobox software (version 1.6.0-dev-1c6b124-modified). The pathway is shown as an interacting network, where green arrows indicate activation, red arrows—inhibition. The color depth of each node of the network corresponds to the logarithms of the case-to-normal (CNR) expression rate for each node, where “normal” is for intact cells, the scale represents an extent of up/downregulation.

