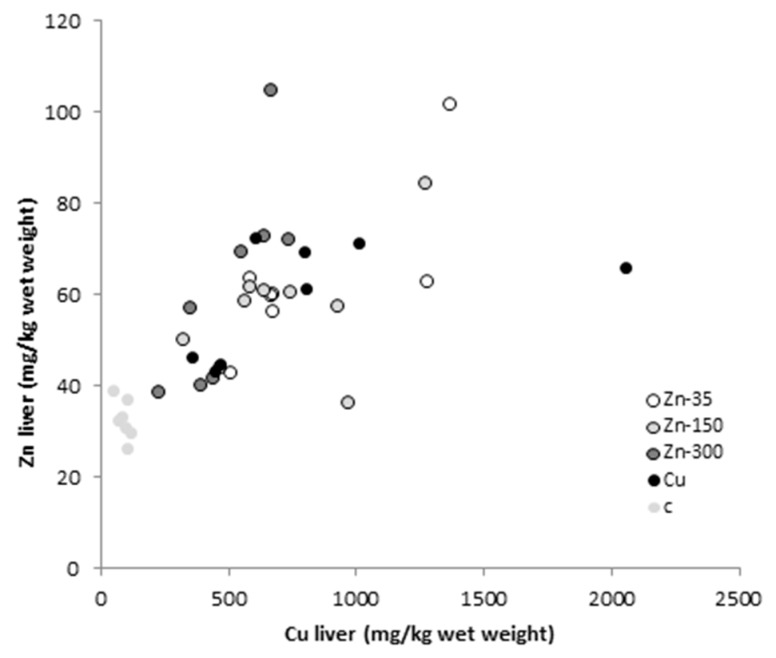
Figure 1.
Scatter plot showing the relationship between Cu and Zn concentrations (mg/kg fresh weight) in the liver of sheep at the end of the study, for the five experimental groups: C, control (no treatment); Cu, 450 mg Cu/kg dry matter (DM); Zn-35, 450 mg Cu + 35 mg Zn/kg DM; Zn-150, 450 mg Cu + 150 mg Zn/kg DM; and Zn-300, 450 mg Cu + 300 mg Zn/kg DM.

