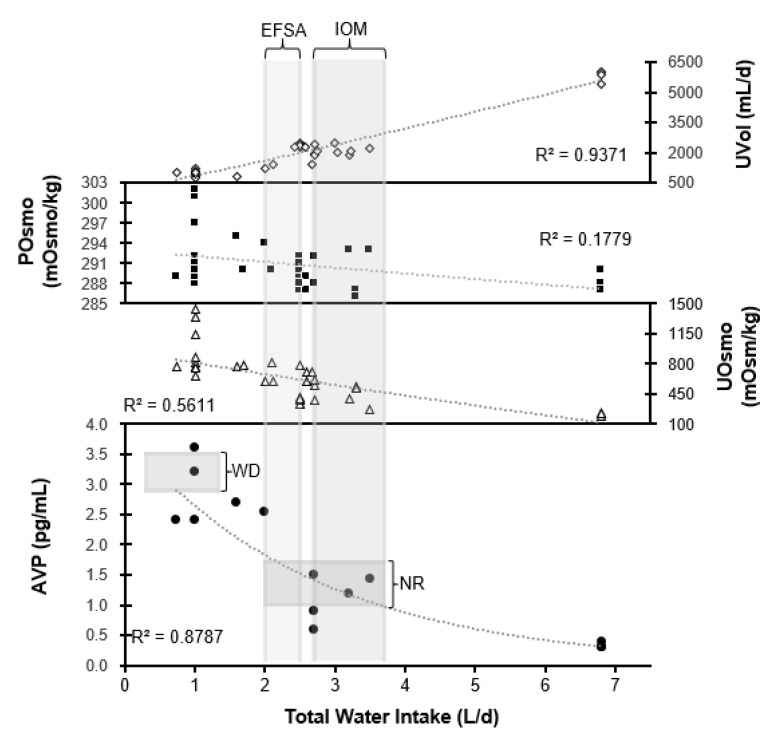
Figure 6.
Urine volume (UVOL), plasma osmolality (POSM), urine osmolality (UOSM, 24h), and plasma AVP plotted against daily total water intake. EFSA and NAM water Adequate Intakes are shown as the vertical shaded column. AVP concentrations associated with water restriction (WR) and baseline resting total water intake (B) (Table 7) appear as horizontal shaded rows. All data points are group mean values (SD not shown) from investigations that measured TWI.

