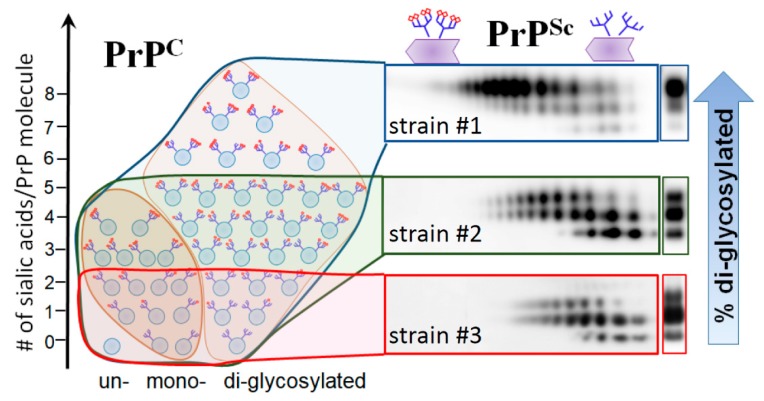
Figure 2.
Schematic diagram illustrating selective recruitment of PrPC sialoglycoforms in a strain-specific manner according to the PrPC sialylation status. The left panel shows distribution of PrPC molecules according to their glycosylation status (in horizontal dimension) and sialylation status (in vertical dimension) ranging from non-sialylated to highly sialylated molecules. PrPC molecules are shown as blue circles and sialic acid residues as red diamonds. The panels on the right show 2D Western blots of three prion strains with different recruitment selectivity. While 263K (strain #1) recruits PrPC sialoglycoforms without strong preferences, hypersialylated PrPC molecules are preferentially excluded from RML (strain #2) and excluded even stronger from atypical PrPSc (strain #3). As a result of strain-specific exclusion of highly sialylated PrPC, ratios of glycoforms within PrPSc shift toward mono- and unglycosylated glycoform, as illustrated by corresponding 1D Western blots. Adapted from Baskakov and Katorcha 2016 [35].

