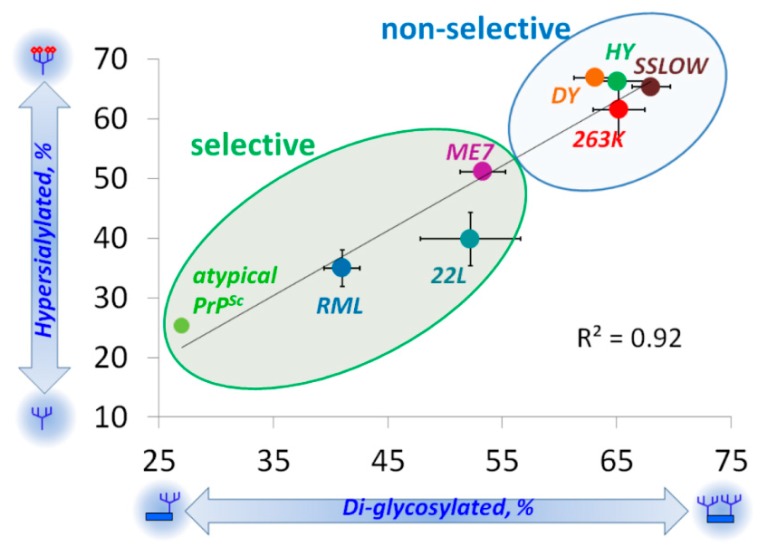
Figure 3.
Correlation between strain-specific sialylation status and glycoform ratio. Strain-specific percentages of diglycosylated glycoforms plotted as a function of strain-specific percentage of hypersialylated glycoforms within PrPSc. Mean and standard deviations are shown (n = 3 animals). Black solid line shows the result of linear fitting of the percent of diglycosylated as a function of the percent of hypersialylated for brain-derived PrPSc. Adapted from Katorcha et al. 2015 [37].

