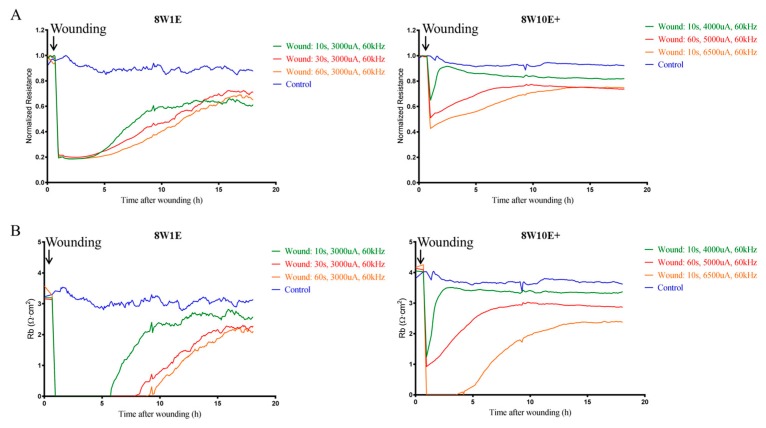
Figure 1.
Comparative analysis of real-time endothelial barrier integrity following wounding on the 8W1E and 8W10E+ arrays. (A) Time-course of normalized resistance measurements following wounding on the 8W1E and 8W10E+ arrays; (B) Time-course of the modelled Rb, the measurement of the endothelial barrier resistance on the 8W1E and 8W10E+ arrays. The hCMVECs were seeded at 0 h at a density of 60,000 cells/cm2 on both 8W1E and 8W10E+ arrays. Wounding was applied at 48 h post-seeding. Three levels of wounding current are represented by green, red, and yellow lines, respectively. Blue line represents control cells that were not electrically wounded.

