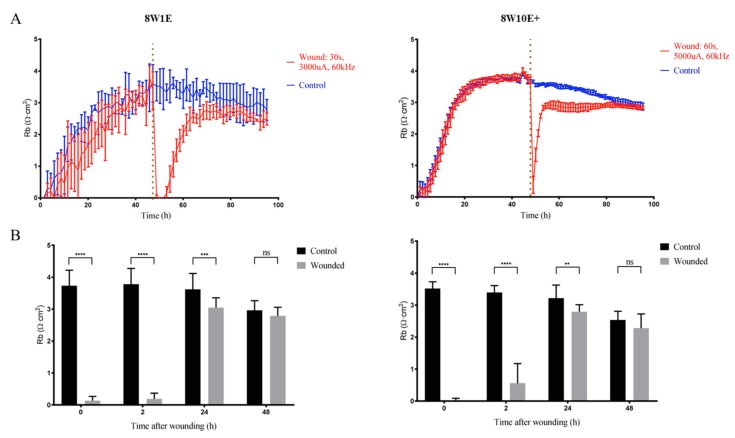
Figure 4.
Changes in the barrier resistance over a time course of 48 h post-wounding on the 8W1E and 8W10E+ arrays. (A) Time-course of the modelled Rb, the measurement of the endothelial barrier resistance on the 8W1E and 8W10E+ arrays. The hCMVECs were seeded at 0 h at a density of 60,000 cells/cm2 on both 8W1E and 8W10E+ arrays. The red line represents a wounding current of 3000 uA at 60 kHz was delivered for 30 s to selected wells on the 8W1E array, and a wounding current of 5000 uA at 60 kHz was delivered for 60 s to selected wells on the 8W10E+ array. The vertical line indicates the application of wounding current at 48 h; (B) Statistical analysis of the modelled Rb post-wounding compared to those at unwounded state on the 8W1E and 8W10E+ arrays. Data show the mean ± S.D (n = 12 wells assessed from three individual experiments, One-way ANOVA, uncorrected Fisher’s LSD test: **p ≤ 0.01, ***p ≤ 0.001, ****p ≤ 0.0001, ns = not significant).

