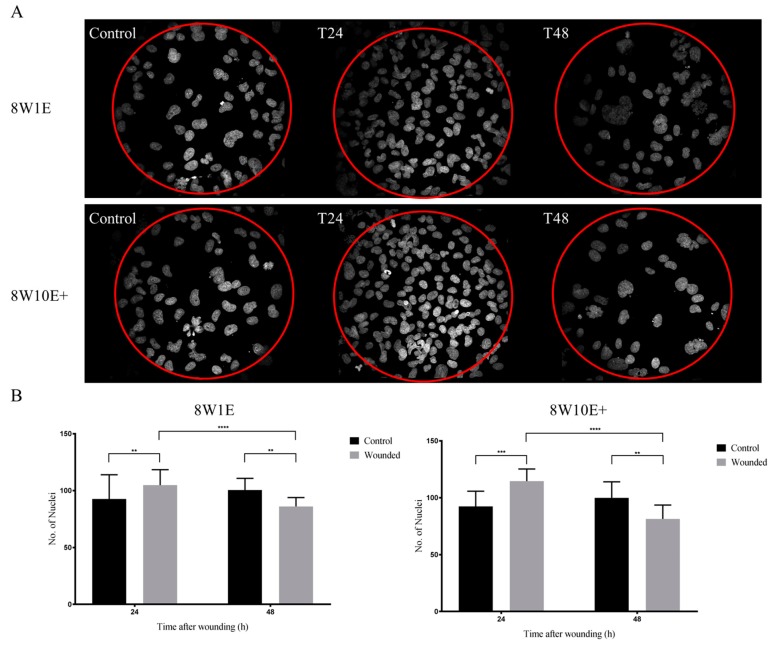
Figure 6.
Cell densities following wounding on the 8W1E and 8W10E+ arrays. (A) Images shown are Z-stack composition between 0.4–0.8 μm at 24 h and 48 h post-wounding. Nuclei are stained with Hoechst (blue) and visualized at 40× magnification on the LSM 710 inverted confocal microscope. The red circle indicates area of electrode; (B) Nuclei count over wounded and unwounded electrodes at 24 h and 48 h post-wounding on the 8W1E and 8W10E+ arrays. Data show the mean ± S.D (n = 9 wells (10 electrodes was selected from each well) from three individual experiments, One-way ANOVA, uncorrected Fisher’s LSD test: **p ≤ 0.01, ***p ≤ 0.001, ****p ≤ 0.0001) The hCMVECs were seeded at a density of 60,000 cells/cm2. A wounding current of 3000 uA at 60 kHz was delivered for 30 s to selected wells on the 8W1E array, and a wounding current of 5000 uA at 60 kHz was delivered for 60 s to selected wells on the 8W10E+ array. Scale bar = 50 μm.

