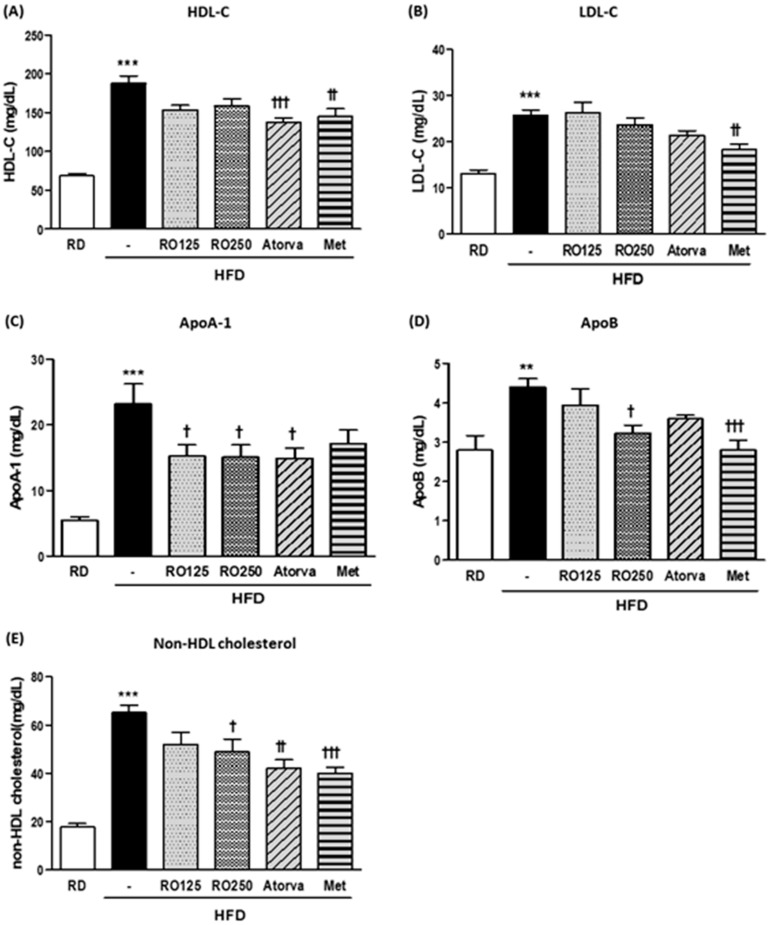
Figure 3.
DIMD mice were fed an HFD with RO or drugs (atorvastatin or metformin) for 16 weeks. Serum from each mouse were prepared. The levels of serum high-density lipoprotein cholesterol (HDL-C) (A), low-density lipoprotein cholesterol (LDL-C) (B), ApoA-1 (C), and ApoB (D) were measured using a biochemistry analyzer. Non-HDL cholesterol values were calculated with the following equation: TC value − HDL-C value, which is presented in (E). Mice were grouped as indicated in Figure 1. Values are presented as means ± SEM (n = 7, each group). * p < 0.05, ** p < 0.01, and *** p < 0.001 compared with RD mice. † p < 0.05, † † p < 0.01, and † † † p < 0.001 compared with HFD mice.

