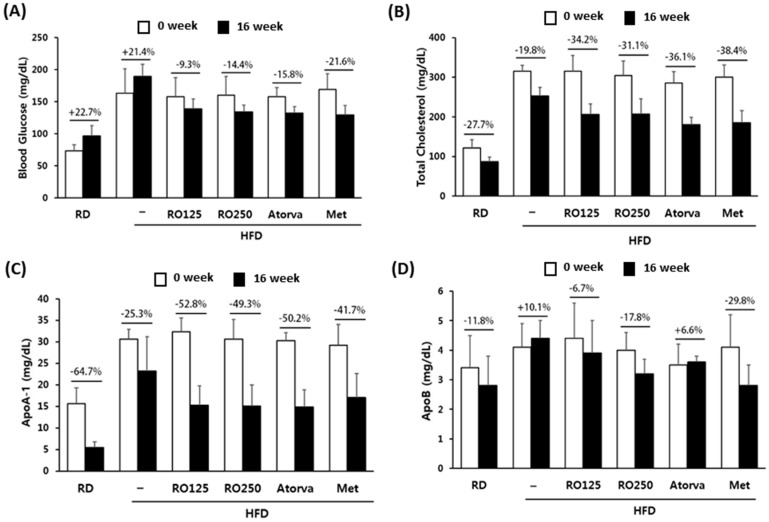
Figure 4.
Representative biomarkers were compared before and after the oral administration of RO and drugs. Changes in blood glucose levels (A), total cholesterol (B), ApoA-1 (C), and ApoB (D) are presented with percentages. Mice were grouped as indicated in Figure 1. Values are presented as means ± SEM (n = 7, each group).

