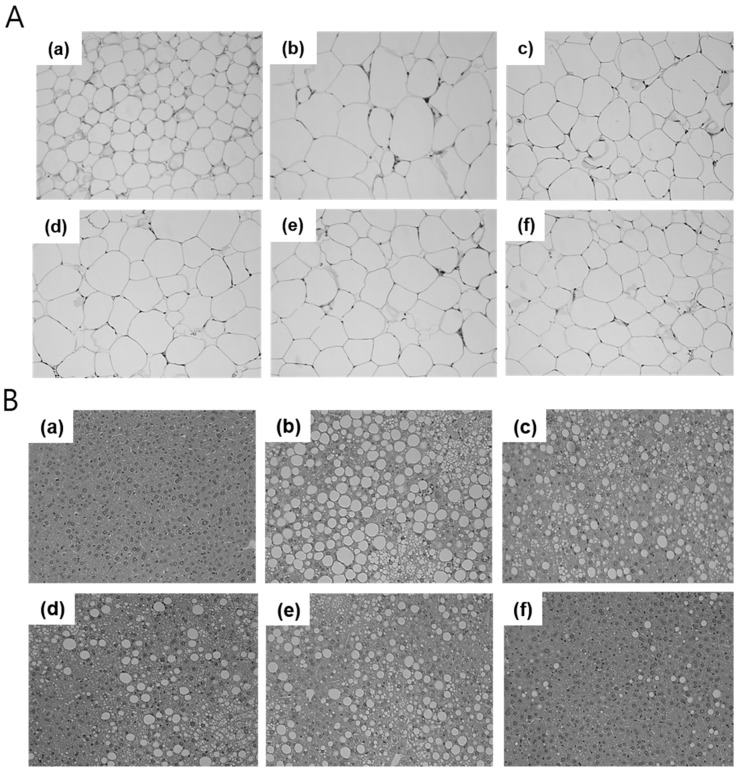
Figure 5.
Representatives of each group were selected and their perirenal fat and liver tissue were stained with hematoxylin and eosin (H&E). Samples from the fat pad (A) and liver (B) were observed through a microscope at ×200 magnification (n = 1, each group). RD: regular diet (a), HFD: high-fat diet (b), HFD + RO 125: HFD-fed mice treated with low dose (125 mg/(kg·day)) of RO (c), HFD + RO 250: HFD-fed mice treated with high dose (250 mg/(kg·day)) of RO (d), HFD + Atorva: HFD-fed mice treated with atorvastatin (10 mg/(kg·day)) (e), HFD + Met: HFD-fed mice treated with metformin (250 mg/(kg·day)) (f).

