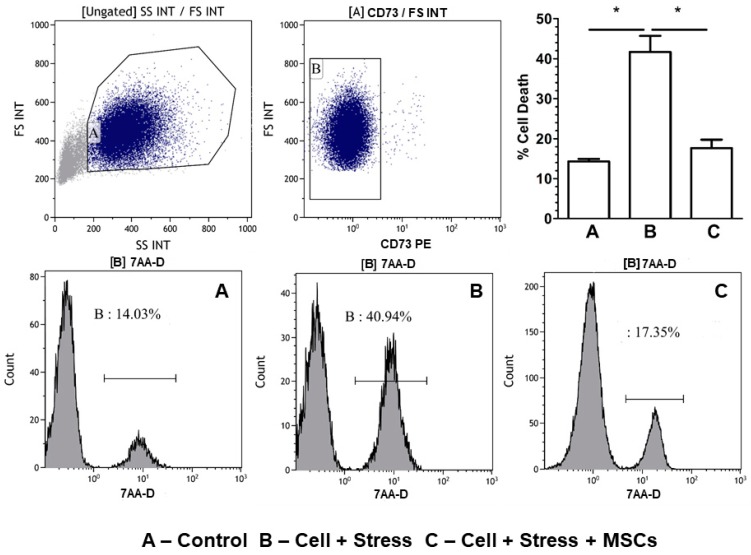
Figure 7.
Cell-death assessment using 7-aminoactinomycin D [7-AAD]. The first two flow histograms, from left to right, are the gating strategy used for segregating the MSCs that would have squeezed through the insert into the coculture experiments. MSCs are excluded from total cell death by negative gating and exclusion. Lower histograms show the cell death percentage of the experimental groups (A) control (neuronal cells without stress), (B) stressed (neuronal cells which has been under stress), and (C) MSC coculture (the rescue of the stressed neuronal cells by coculturing MSC through insert). Quantification and percent cell death are shown in the upper-right corner figure. Bars represent mean ± SEM, * p < 0.05, significant; n = 3.

