Figure 3.
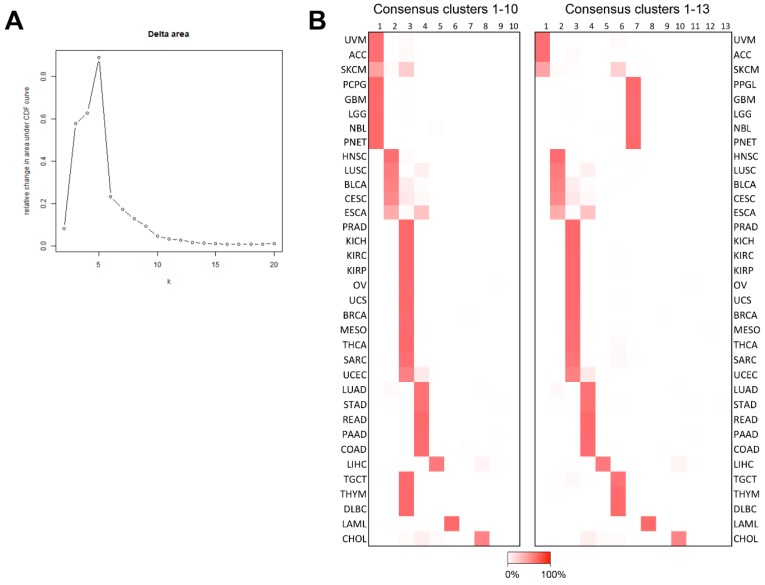
Pan-cancer consensus clustering. Unsupervised consensus clustering of 3319 TCGA and TARGET samples annotated for their specific cancer type. (A), Delta CDF plot with information on the additional explanatory power provided through increasing the number of clusters. Y-axis, relative change in the area under CDF curve and y-axis; k, the number of consensus clusters. (B), Proportion of cases assigned to the different clusters ranging from 0% (white) to 100% (red) in both 10 and 13 clusters. X-axis, consensus cluster numbers and y-axis, a cancer type.

