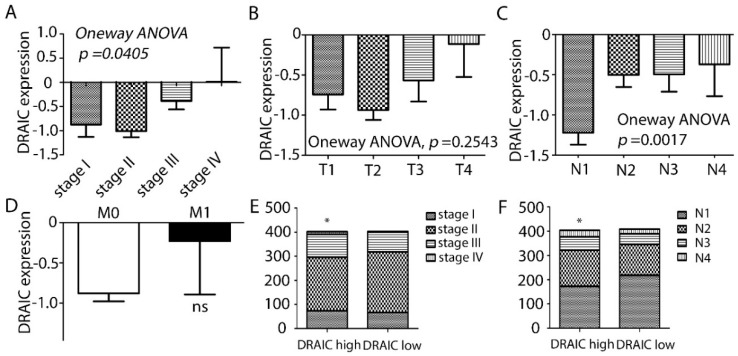
Figure 2.
High DRAIC expression in breast cancer correlates with certain clinical pathological parameters. (A–D) The 828 breast cancer patients were divided according to their neoplasm disease stages (A), cancer tumor stages (B), neoplasm disease lymph node stages (C), and cancer metastasis stages (D). DRAIC expression in each different group of stages was shown as mean ± SEM (standard error of the mean). Statistical significance was calculated by either one-way ANOVA (for A–C) or two-tailed student’s t-test (for D). (E,F) The 828 breast cancer patients were divided into DRAIC high and DRAIC low group based on the median value of DRAIC expression. In each group, a stacked bar chart was created to show the distribution of patients in different neoplasm disease stages (E) or lymph node stages (F). Chi-square tests were used to test the differences. * indicates p < 0.05; ns, not significant. DRAIC expression was shown as log2 value.

