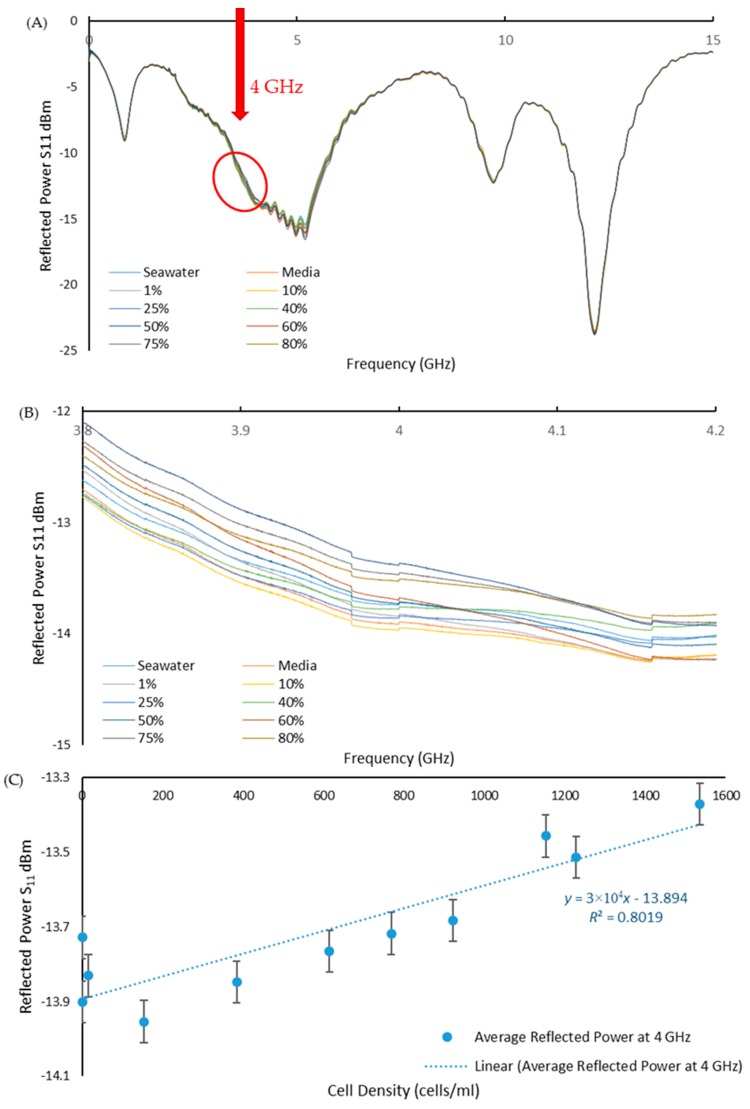
Figure 5.
(A) Reflected power S11 versus frequency graph for PTFE 8pr Au in 0.01–15 GHz frequency range; (B) magnified part of spectra (A) (in red circle) in 3.8–4.2 GHz range to illustrate the effect of the cells concentration change on the amplitude of the reflected power signal; and (C) Linear change (R2 = 0.8019) in the reflected power S11 amplitude with increasing cell density at 4 GHz frequency.

