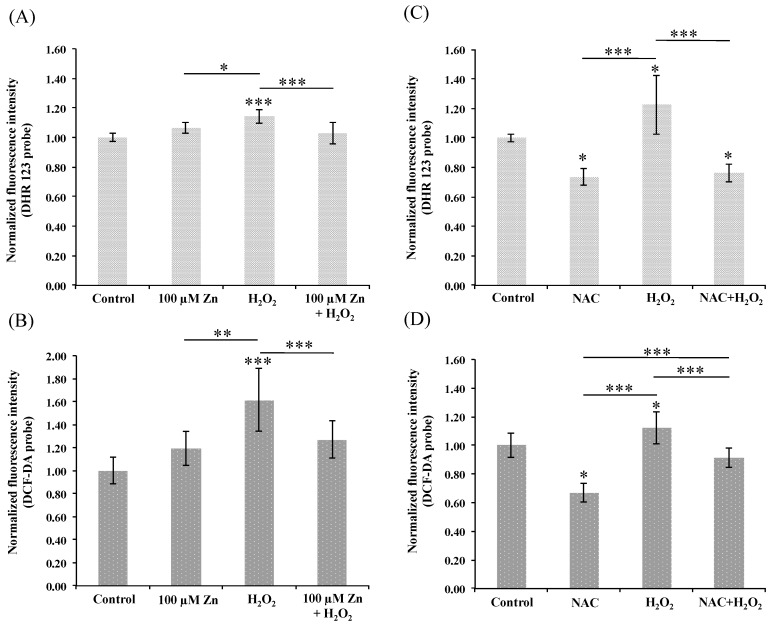
Figure 1.
Histograms showing normalized fluorescence intensity of DHR 123 (panels A and C) and DCF-DA (panels B and D) probes in different treatment groups of HRPEsv cells, analyzed by a fluorescent plate reader. HRPEsv cells were either: (i) non-treated (see control bar in panels A–D); (ii) treated with H2O2 (2 mM for 30 min, see H2O2 bar in panels A–D); (iii) treated with zinc alone (100 μM for 24 h, see Zn bar in panels A and B); and (iv) pre-treated wither either 100 μM zinc for 24 h (see Zn + H2O2 bar in panels A and B) or (v) 10 mM NAC (see NAC + H2O2 bar in panels C and D) and followed in both cases by a treatment with H2O2 (2 mM for 30 min), respectively. Mean ± SD is plotted for 6 replicates for each condition. Data analyzed by one-way ANOVA followed by Tukey’s multiple comparison tests. * p < 0.05; ** p < 0.01; *** p < 0.001.

