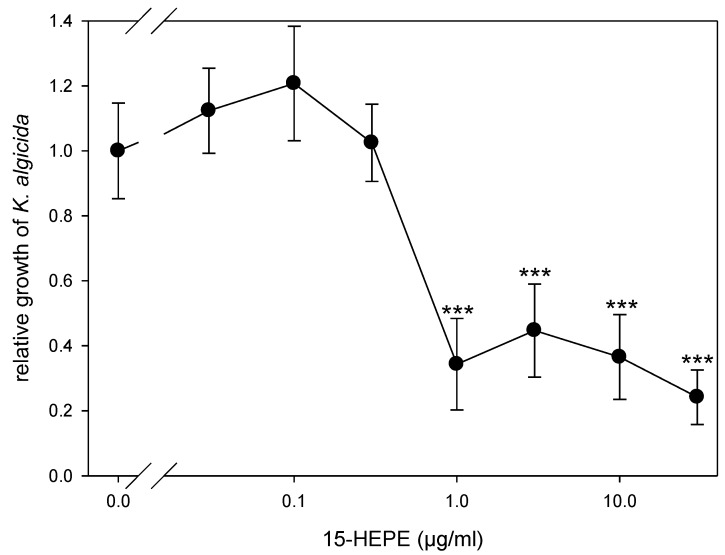
Figure 4.
Concentration–response curve for 15-HEPE inhibition of Kordia algicida growth (mean ± SD, n = 5). Growth was monitored after 6 h in the presence of different concentrations of 15-hydroxylated eicosapentaenoic acid (HEPE) and normalized to the control at 0 µg/mL (no added HEPE). Statistically significant differences (unpaired t-test) between control cultures and cultures treated with K. algicida are marked with *** (p < 0.001).

