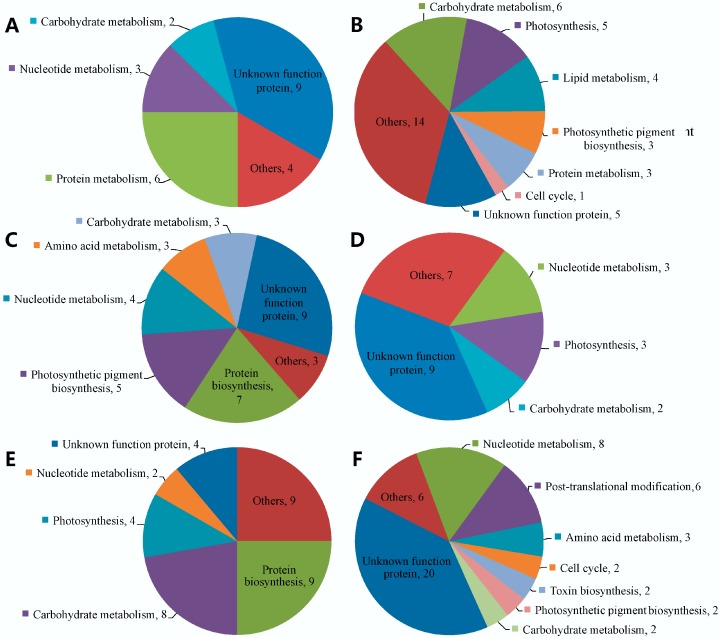
Figure 4.
Functional distribution of differentially expressed proteins. (A) Upregulated proteins in T5 vs. T9. (B) Downregulated proteins in T5 vs. T9. (C) Upregulated proteins in T9 vs. T10. (D) Downregulated proteins in T9 vs. T10. (E) Upregulated proteins in T10 vs. T11. (F) Downregulated proteins in T10 vs. T11.

