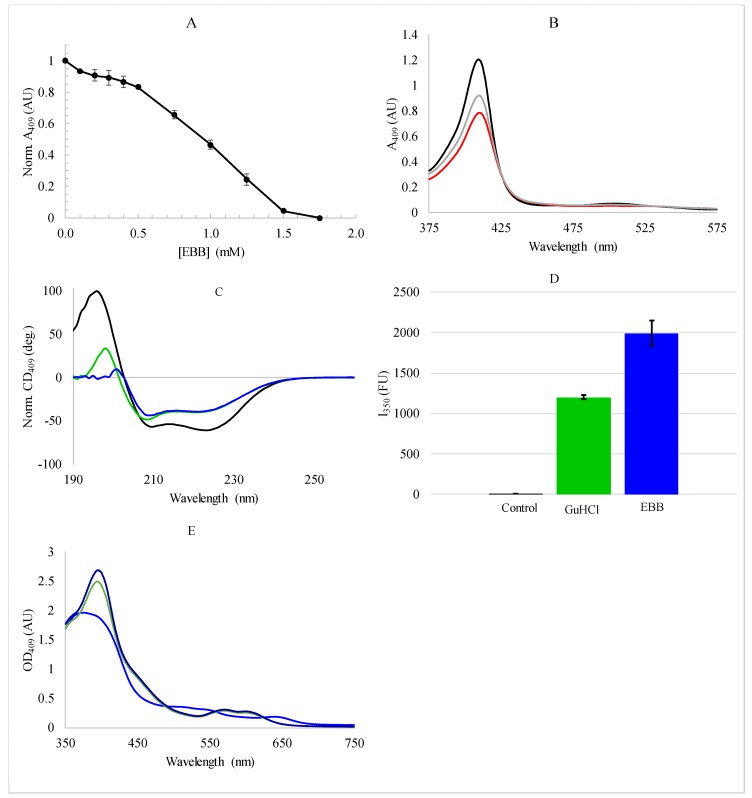
Figure 2.
Spectroscopic analysis of myoglobin unfolding. (A) Heme absorbance at 409 nm (A409) as a function of EBB concentration; (B) Absorbance spectra of myoglobin with 0 mM EBB (black), 1 mM EBB (gray), or 1.75 mM EBB (red); (C) Representative circular dichroism (CD) spectra for myoglobin with: 0 mM EBB (black), 1.75 mM EBB (green), 8 mM EBB (blue); (D) Fluorescence intensity (I) of Trp emission from myoglobin in buffer (black), denatured with 1.75 mM EBB (blue), or denatured with 3 M GuHCl (green). Fluorescence data are the averages and standard deviations of five samples; (E) Absorbance spectra of 50 µM heme B in phosphate buffer (black) or buffer supplemented with 1.75 mM EBB (green) or 8 mM EBB (blue). All samples were in 2 mM sodium phosphate, pH 7.

