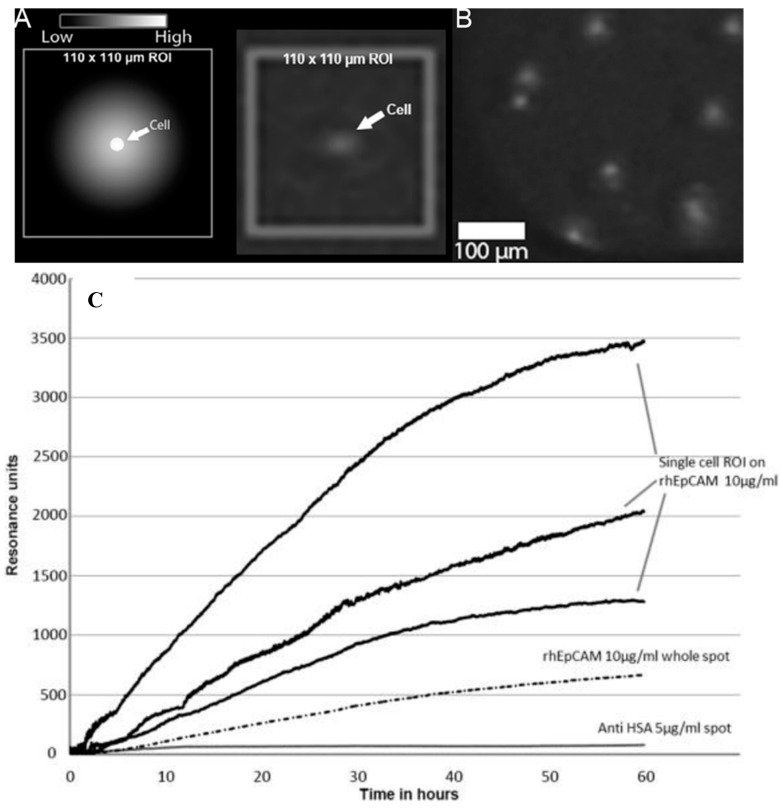
Figure 4.
Single-cell antibody secretion monitored with SPRi. Panel (A): Schematic representation of cell that secretes antibodies; the sensor surface captures the secreted molecules in a halo around the cell. Panel (B): SPR-image of VU1D9 cells on top of the sensor surface with secreted anti-EPCAM antibodies. Panel (C): SPR sensorgram showing the variation of single-cell production of anti-EpCAM by VU1D9 cells. Noise levels are high due to very small, 110 µm2 sized Regions of Interest. As a reference, anti-HSA and rhEpCAM whole spot averaged signals with large Region of Interests are shown. The signals were zeroed in order to compensate for the background.

