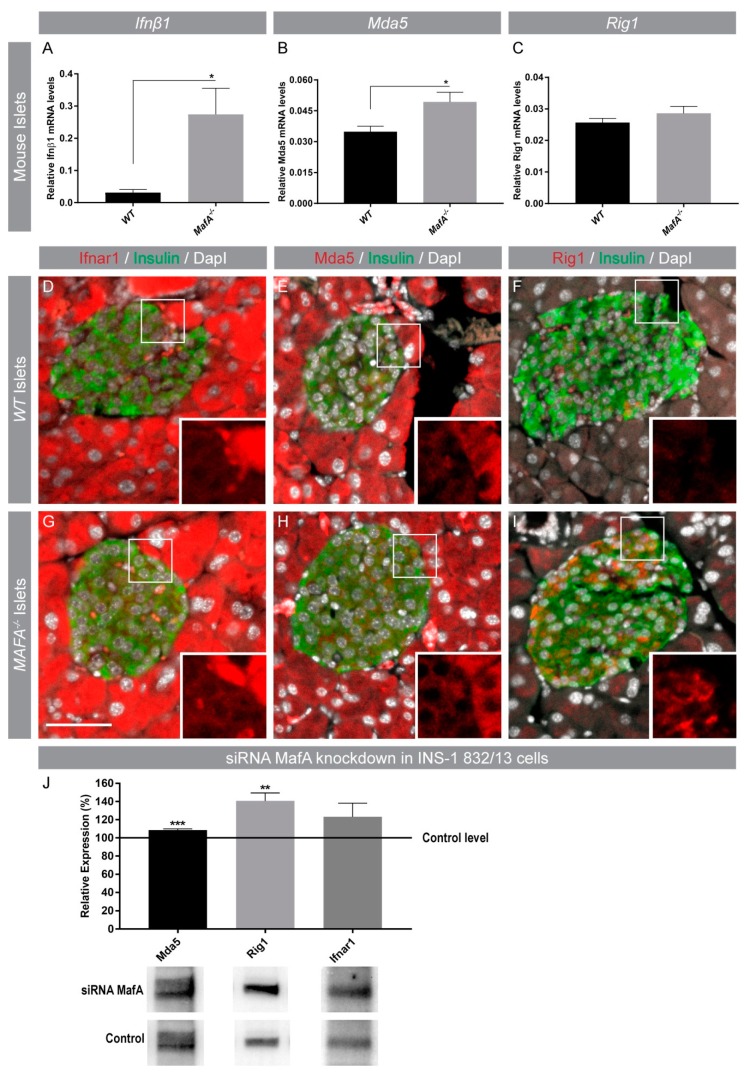
Figure 4.
MafA loss induces expression of IFI genes. (A–C) Gene expression analysis of (A) Ifnβ1 and IFI genes (B) MDA5 and (C) Rig1 in MafA deficient mouse islets, sample number (n) is at least 5 or 6 mice per genotype. Data are presented as ± standar error of the mean and were analyzed using Welch’s t-test with * p < 0.05 as significant. (D–I) WT and MafA−/− pancreatic sections showing immunohistochemical stainings for Ifnar1, Mda5, Rig1 (red) with insulin (green) co-expression, and nuclei (grey). Images were captured at 20× magnification and the scale bar is 50 µm. (D–I) Small white boxes depict area shown in the inserts as magnified portions. (J) Western blot analysis from INS-1 832/13 cells treated with small interfering RNA (siRNA) MafA showing relative protein expression (n = 4) ** p < 0.01, *** p < 0.001.

