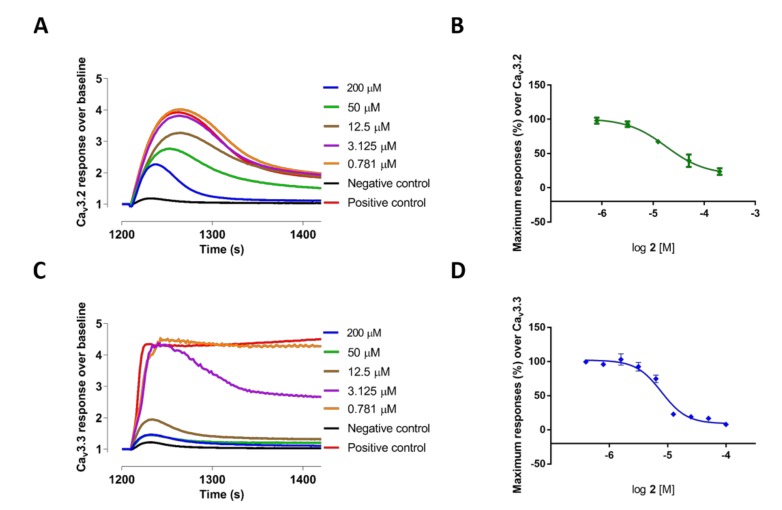
Figure 1.
(A) Representative fluorescent traces of the CaV3.2 window current before and after addition of compound 2; (B) the concentration-response curve for compound 2 (IC50 = 18.16 μM, n = 4); (C) representative fluorescent traces of the CaV3.3 window current before and after addition of compound 2; and (D) the concentration response curve for compound 2 (IC50 value of 7.83 μM, n = 4).

