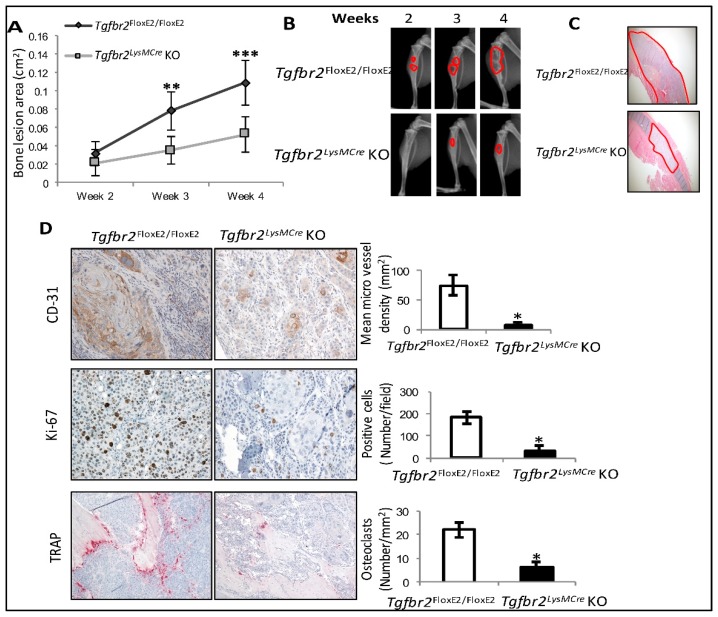
Figure 1.
H1993-induced bone lesions were inhibited in Tgfbr2LysMCre knockout (KO) mice. (A) Quantification of bone lesion areas in the control and KO mouse tibiae. (B) Representative bone lesions (red outlines) shown by weekly X-ray images. (C) Hematoxylin and eosin (H&E) staining images (4×) confirm tumor growth in the mouse tibiae (red outlines) at 4 weeks (wk) post-injection. (D) Representative mouse tibiae at 4 wk post-injection, stained for CD31 (20×), Ki67 (20×), or TRAP (10×). Mean ± SD, n ≥ 10 per group. *** p < 0.001, ** p < 0.01, * p ≤ 0.05, by linear mixed-effect models for bone lesions and Student’s t-test for paired comparison.

