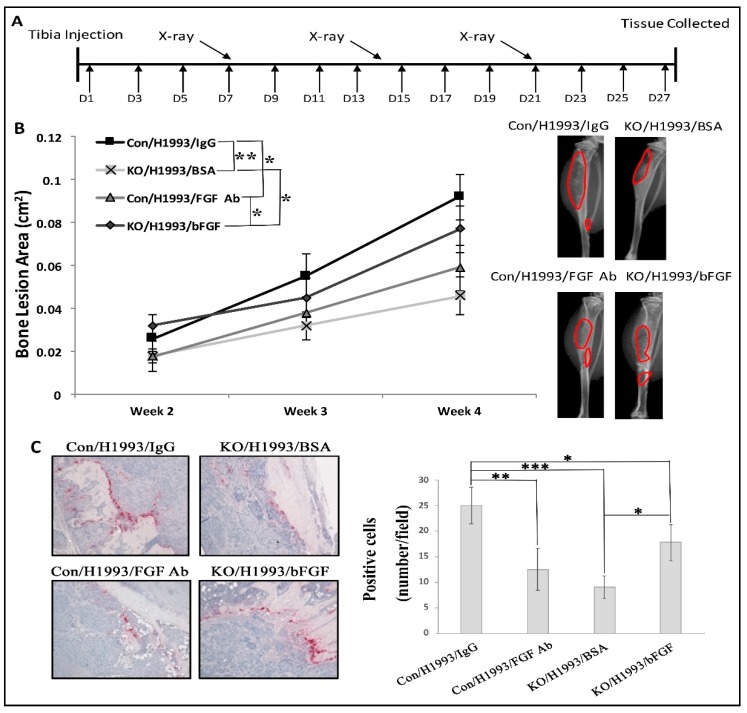
Figure 2.
bFGF rescued H1993-induced lytic lesion development in Tgfbr2LysMCre KO mice. (A) The schedule of drug treatment, X-ray image acquisition, and end-point tissue collection. (B) Quantification of bone lesion areas and representative X-ray images at 4 wk post-injection. (C) Representative TRAP staining (20×). Mean ± SD, n ≥ 7 per group. *** p < 0.001, ** p < 0.01, * p ≤ 0.05, by linear mixed-effect models for bone lesions or by ANOVA for quantification of TRAP.

