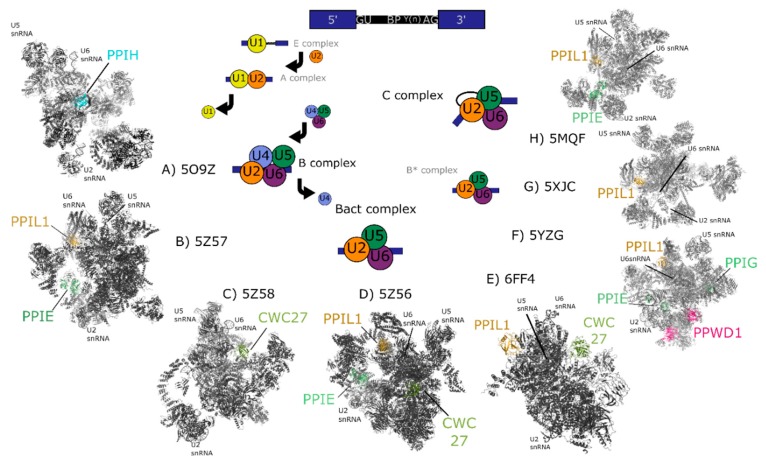
Figure 3.
Cryo-electron microscopy structures of spliceosomal complexes. Center, a graphical representation of the canonical metazoan pre-mRNA substrate, including the 5′ and 3′ exons, the consensus 5′ and 3′ splice recognition sites, the presence of the branchpoint (BP) that forms the intermediate splicing lariat structure, and the polypyrimidine tract (Y(n)). The classical graphical representation of the splice cycle, shown in the center of the figure, follows the association and dissociations of uridine-rich small nuclear RNAs (U-snRNAs) to characterize the splicing intermediate (E, A, B, Bact, B*) and catalytic (C) complexes. Complexes discussed in the text are shown on the outside of the splice cycle, with spliceophilins labeled and highlighted in color. The key U snRNAs U2, U5, U6 are present in all structures, and their rough positions labeled in each structure. The structures are roughly aligned to the part of the splice cycle they are thought to represent: B complex (PDB ID: 5O9Z) [24], Bact (PDB IDs: 5Z57, 5Z58, 5Z56, and 6FF4) [25,26], or C (PDB IDs: 5YZG, 5XJC, and 5MQF) [27,28,29].

