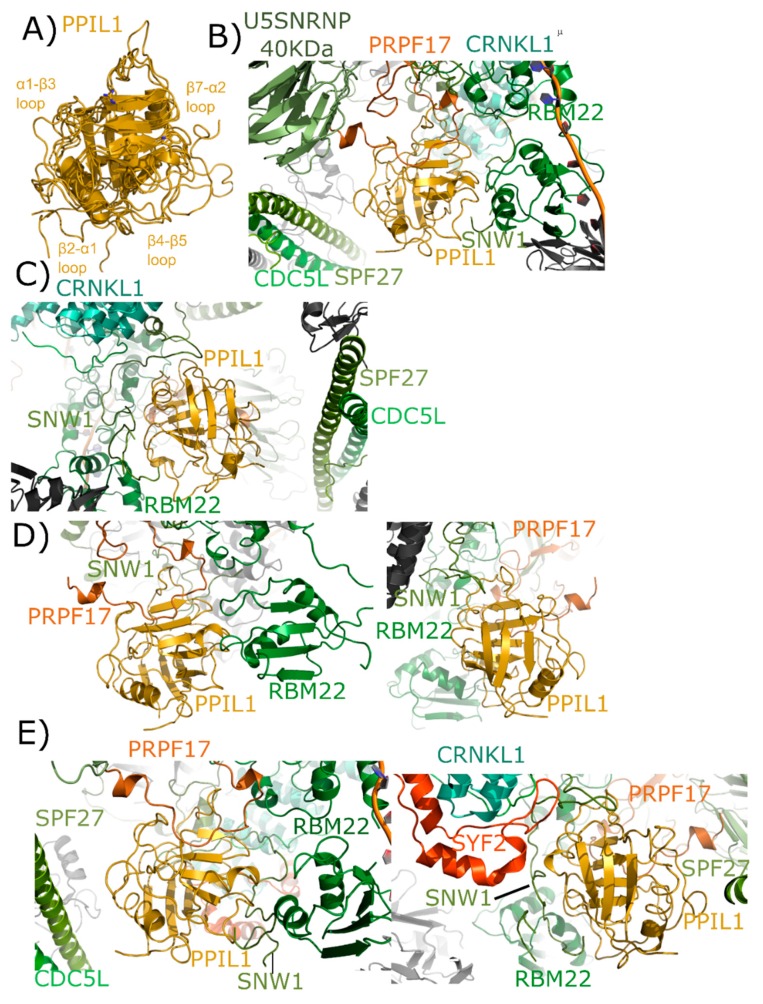
Figure 6.
Structures of PPIL1 in solution and in spliceosomes. In (A) PPIL1 is shown in cartoon representation (overlay of PDB IDs: 1XWN, 2K7N, and 2X7K). Selected catalytic residues and protein–protein interaction regions are labeled, including the regions proposed to interact with SNW1/SKIP in solution. (B,C) Mature Bact complexes contain PPIL1 (PDB ID: 5Z56). (B) The view from the catalytic face of PPIL1. Proline 95 from PRPF17, which is centered in the S1 pocket, is highlighted. (C) The view from the back-face of PPIL1. The interactions between PPIL1 and SNW1, RBM22, CRNKL1, and CDC5L are more clearly seen. Note the extensive ordering of the disordered region of SNW1 around the β4–β5 and β7–α2 loop of PPIL1. The PPIL1 region in the late Bact complex (PDB ID: 5Z57) is identical to that of PDB ID: 5Z56, and is not shown here. (D) The PPIL1 neighborhood in the Bact complex (PDB ID: 6FF4). While many of the interactions are similar to those shown in (B,C), many of the proteins seen in that complex are missing from this model. Left panel, the view from the catalytic face; right panel, the view from the back face. Models of CRNKL1, CDC5L, and SPF27 are not included, and the ordered region of SNW1 is decreased. (E) The PPIL1 neighborhood in the C complex (PDB ID: 5YZG) centered on the catalytic face (left) and the back-face (right). The PPIL1 interaction neighborhood is similar to that shown in (B,C) with the addition of the SYF2 protein to the model, which interacts with the back-face of PPIL1 near α2. The models of C* complex in 5XJC and 5MQF are not shown, as the interaction environment around PPIL1 is very similar to that in (E).

